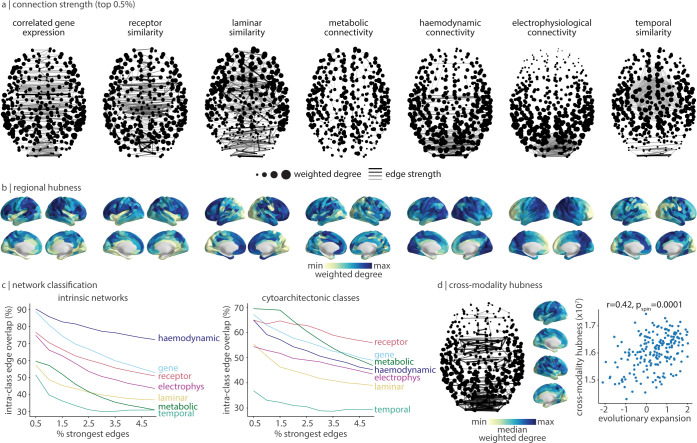
Fig 3. Cross-modal hubs.
(a) For each connectivity mode, we plot the 0.5% strongest edges. Darker and thicker edges indicate stronger edges. Points represent cortical regions and are sized according to the sum of edge weights (weighted degree). Cortical views are axial, with anterior regions at the top of the page (for coronal and sagittal views, see S4 Fig). (b) For each connectivity mode, regional hubness is defined as the sum of rank transformed edge weights across regions. (c) For a varying threshold of strongest edges (0.5%–5% in 0.5% intervals), we calculate the proportion of edges that connect 2 regions within the same intrinsic network [49] (left) and cytoarchitectonic class [71] (right). (d) Across all 7 connectivity modes, we calculate the median edge rank of each edge and plot the 0.5% strongest edges (left). Likewise, we calculate the median hubness (shown in panel b), which we find is significantly correlated with evolutionary cortical expansion (r = 0.42, pspin = 0.0001) [73]. The data underlying this figure can be found at https://github.com/netneurolab/hansen_many_networks.

