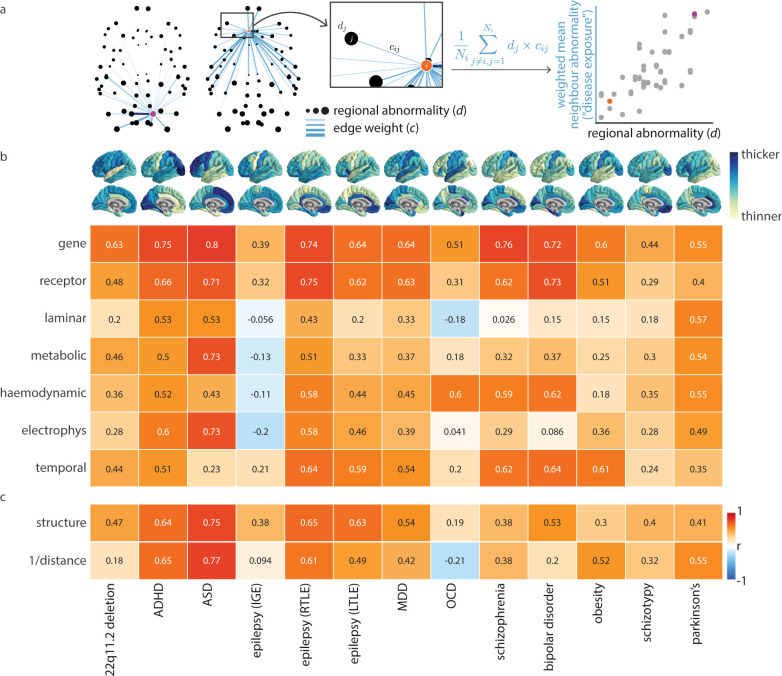
Fig 4. Contributions of connectivity modes to disease vulnerability.
Abnormal cortical thickness profiles for 13 neurological, psychiatric, and neurodevelopmental disorders were collected from the ENIGMA consortium (cortex plots shown in panel b; N = 21,000 patients, N = 26,000 controls [79,80]). (a) Given a specific disorder and connectivity mode, dj represents the abnormal cortical thickness of region j, and cij represents the edge weight (similarity) between regions i and j. For every region i, we calculate the average abnormal cortical thickness of all other regions j≠i in the network, weighted by the edge strength (“disease exposure”; note that we omit negative connections, such that Ni represents the number of positive connections made by region i). Next, we correlate disease exposure and regional abnormal cortical thickness across cortical regions (scatter plot; points represent cortical regions). We show the connectivity profiles of 2 example regions (highlighted in purple in the left brain network and orange in the right brain network). (b) The analytic workflow presented in panel (a) is repeated for each disorder and connectivity mode, and we visualize Spearman correlations in a heatmap. (c) This analysis is repeated for weighted structural connectivity (where we only consider structurally connected regions), and Euclidean distance (where we always consider all regions in the network). We also repeat this analysis for the fused network (see Fusing connectivity modes), and results are shown in S6 Fig. The data underlying this figure can be found at https://github.com/netneurolab/hansen_many_networks. ADHD, attention-deficit/hyperactivity disorder; ASD, autism spectrum disorder; ENIGMA, Enhancing Neuroimaging Genetics through Meta-Analysis; MDD, major depressive disorder; OCD, obsessive-compulsive disorder.

