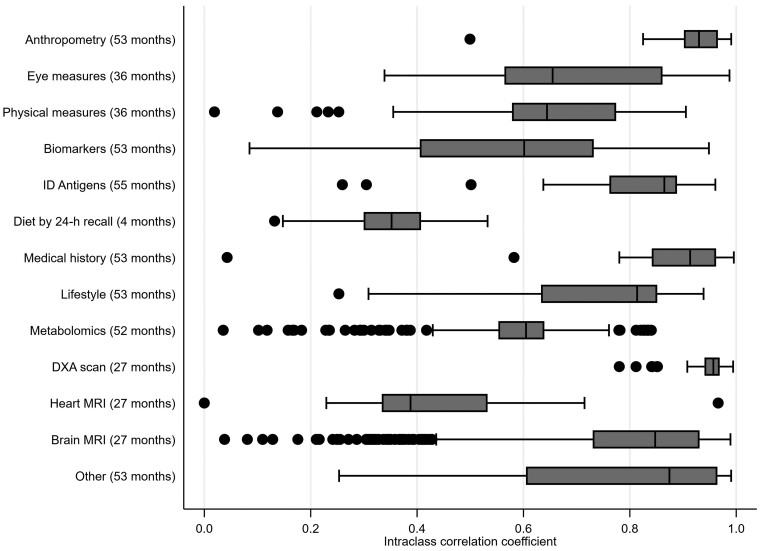
Figure 2.
Box and whisker plot of intraclass correlation coefficients measuring overall agreement between repeated measurements by variable category. The months in brackets after each category name are the median time between the first and second measures. For each category the vertical line inside the horizontal box reflects the median intraclass correlation coefficient for that category; the box denotes the interquartile range (IQR); the vertical lines at the end of the protruding horizontal lines from each box reflect the adjacent values (values within 1.5 times the IQR) and the dots denote separate points more extreme than the adjacent values. ID, infectious disease; DXA, dual-energy X-ray absorptiometry; MRI, magnetic resonance imaging

