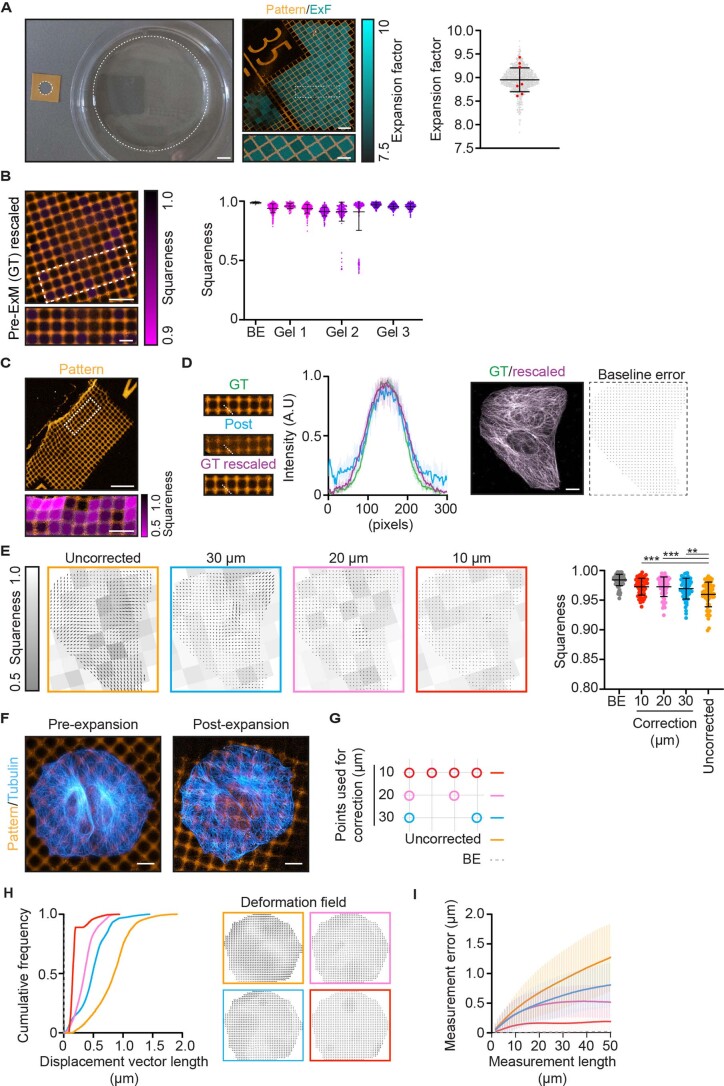
Extended Data Fig. 6. ExM anisotropy and GelMap validation.
a) Left: example of typical macroscopic expansion factor determination with silicon mold on left and expanded gel on the right. Middle: expanded region from the same gel showing GelMap grids (orange), with the local expansion factor for each square color-coded and overlayed. Right: quantification of expansion factor of individual squares (2 regions, n = 849 squares, expansion factor 8.9 ± 0.2 (mean ± SD), gray), with macroscopic measurements from unbiased participants overlayed (n = 7 participants, expansion factor 8.9 ± 0.3 (mean ± SD), red). b) Left: Baseline error (BE) of the squareness quantification as determined by analysis of a resampled unexpanded grid, shown color-coded in magenta (note the same scaling of the squareness color-code as in Fig. 2a). Right: Quantification of squareness of individual squares for BE (n = 91 squares, mean ± SD squareness value of 0.99 ± 0.006) and expanded gels. 3 expanded gels, 3 regions per gel, n = 533, 116, 391, 383, 269, 756, 453, 396, 277 squares, respectively, with mean ± SD squareness values of 0.94 ± 0.04, 0.96 ± 0.02, 0.94 ± 0.03, 0.91 ± 0.04, 0.91 ± 0.08, 0.91 ± 0.2, 0.97 ± 0.02, 0.95 ± 0.02, 0.95 ± 0.03, respectively. c) Locally deformed region near a tear of expanded patterned grid (20 µm squares) with deformation in zoomed region color-coded in magenta as defined by squareness (expansion factor: 8.1). d) Baseline error determination for landmark-based registration using BigWarp. First, a non-expanded grid (GT) was taken and the average number of pixels in a square crossing was determined and compared to that of the expanded image (Post). Next, a copy of the pre-expanded grid was resampled (GT rescaled) to the same pixel size as the post-expansion image and used for landmark-based registration to the GT image. e) Deformation fields from Fig. 2f overlayed with squareness analysis of the same images (left) and quantification of squareness after GelMap correction (right). n = 91, 58, 58, 58, 60 squares, respectively, with mean ± SD squareness values of 0.98 ± 0.001, 0.97 ± 0.002, 0.97 ± 0.002, 0.97 ± 0.002, 0.96 ± 0.003, respectively. **p < 0.01, ***p < 0.001 (Mann–Whitney U-test, two-tailed test), exact p values from left to right: p = 0.0005, p = 0.0001, p = 0.0074. f) Pre- and post-expansion images of U2OS cells cultured on GelMap coverslips (grid size: 10 µm, expansion factor: 9.2) stained for tubulin (cyan) and myc-tag (orange). g) Schematic of landmark spacing used for correction in E, H and I. h) Quantification of displacement vector length for equidistantly spaced points (1 µm) in the cellular area for uncorrected and pattern-corrected images registered to ground truth tubulin channel. Corresponding deformation fields are color-coded and shown on the right. i) Quantification of measurement error (deviation from expected distance assuming isotropic expansion) between pairs of points for a measurement length (mean ± SD). Scale bars: A: left, 12 mm, right, 100 µm, zoom: 40 µm. B and C: 100 µm, zoom: 40 µm, D and F: 10 µm. Scale bars in expanded samples reflect pre-expansion sizes.

