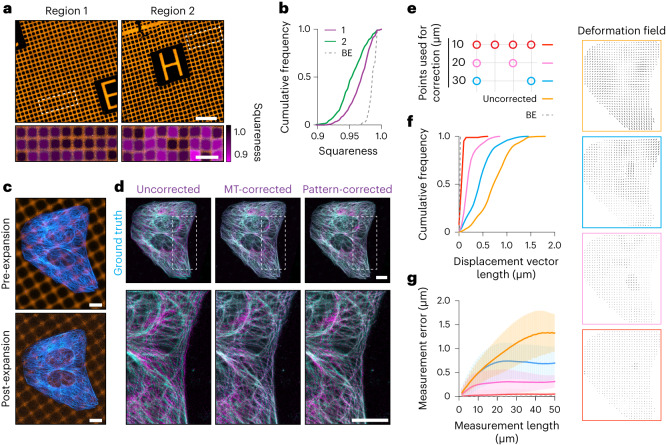
Fig. 2. Validation of GelMap-based corrections using pre- and post-expansion imaging.
a, Two representative regions of expanded GelMap grids (20 µm squares) from the same gel. Deformation as defined by squareness is color-coded in magenta in zooms of boxed regions (expansion factor, 9.0 and 8.7 for region 1 and 2, respectively). b, Cumulative frequency distribution of squareness values of individual squares in region 1 (n = 453, magenta) and region 2 (n = 396, magenta) from a. Dashed line indicates baseline error (BE) resulting from uncertainties in the detection of crossings (Methods). c, Pre- and post-expansion images of U2OS cells cultured on nanobody-patterned GelMap grids (grid size, 10 µm; expansion factor, 9.1), stained for tubulin (cyan) and myc-tag (orange). d, Linear (left column; uncorrected) and nonlinear transformation (middle column; MT-corrected) of the post-expansion tubulin channel registered to the pre-expanded ground-truth tubulin channel, overlayed with pre-expanded ground-truth image. Pattern-corrected tubulin channel (10-µm grid spacing) overlayed with the pre-expanded ground-truth image (right column, pattern-corrected). Boxed regions correspond to zooms below. Biological replicate can be found in Extended Data Fig. 6e. e, Schematic of landmark spacing used for pattern correction. The 10-µm GelMap grid was used for landmark registration, with landmarks removed as indicated to mimic GelMap grids with larger spacing. f, Quantification of displacement vector length for equidistantly spaced points (1 µm) in the cellular area for pattern-corrected images registered to the ground-truth tubulin channel. Dashed line indicates BE due to manual landmark selection. Corresponding deformation fields are color-coded and shown on the right. g, Quantification of measurement error (deviation from expected distance assuming isotropic expansion) between pairs of points for a measurement length (mean ± s.d.). Dashed line indicates BE due to manual landmark selection. Scale bars, 100 µm (a), zoomed regions 40 µm;10 µm (c,d). Scale bars in expanded samples reflect pre-expansion sizes.

