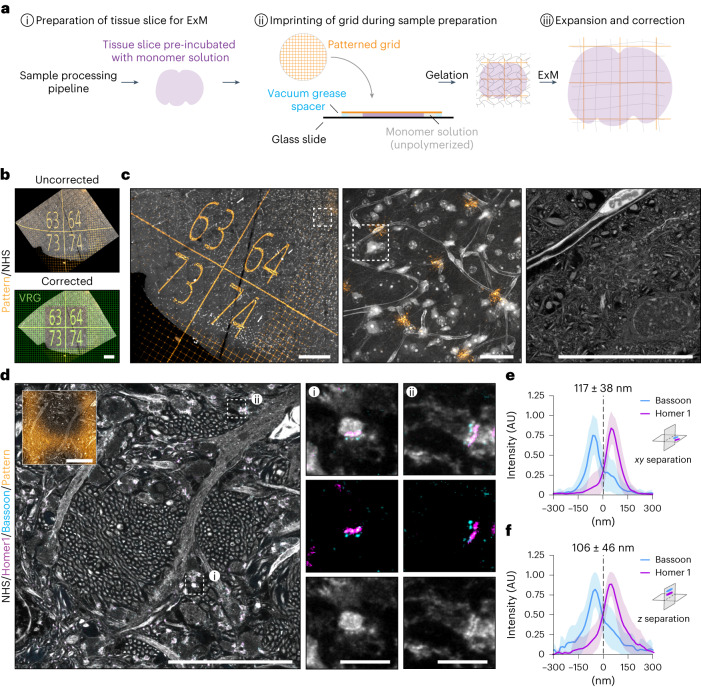
Fig. 4. GelMap can be imprinted onto tissue slices and used for correction.
a, Schematic of workflow when using GelMap for tissue slices during sample preparation. b, Region of dissected mouse brain tissue (cortex) expanded using TREx (expansion factor, 7.6) and stained for total protein (gray) and myc-tag (orange) and imaged by confocal microscopy (top). The pattern channel was registered to a virtual reference grid (green) to correct for deformation (bottom). The resulting nonlinear transformed protein channel was used for subsequent visualization of corrected tissue organization. c, Using GelMap to bridge scales of tissue vasculature organization from 1.3 × 1.2 mm (left) to 110 × 110 µm (middle) and 25 × 25 µm (right) (corrected dimensions) high-resolution zooms of blood vessel with surrounding tissue. Zoomed regions indicated with white boxes. Left and middle panels are maximum projections of 60 frames (corrected z-spacing: 700 nm). d, Region of dissected mouse brain tissue (hippocampus) expanded with TREx and stained for Bassoon (cyan), Homer1 (magenta) and total protein (gray) after expansion. Total protein stain reveals dense bundles of thin, unmyelinated axons (Mossy fibers) projecting perpendicularly to the imaging plane and intersecting with dendrites from neurons in the CA3 region (left). At such intersections, synapses can be identified by the presence of closely apposed protein densities (gray), colocalizing with pre- and postsynaptic scaffold proteins Bassoon (cyan) and Homer1 (magenta), respectively. White boxes mark regions used for the zooms. Corrected GelMap pattern indicated in smaller insert. e, Quantification of Bassoon/Homer1 separation for synapses whose synaptic axes are within the imaging plane. Average separation 117 ± 38 nm (mean + s.d.)), n = 69, three biological replicates. f, Quantification of Bassoon/Homer1 separation for synapses whose synaptic axes are approximately perpendicular to the imaging plane. Average separation 106 ± 46 nm (mean + s.d.)), n = 50, three biological replicates. The difference between the values in e and f are not statistically significant (NS; Mann–Whitney U-test, two-tailed test). Scale bars, 200 µm (b); 200 µm (left), 20 µm (middle and right) (c); 10 µm, 1 µm (zooms) (d). Scale bars in expanded samples reflect pre-expansion sizes.

