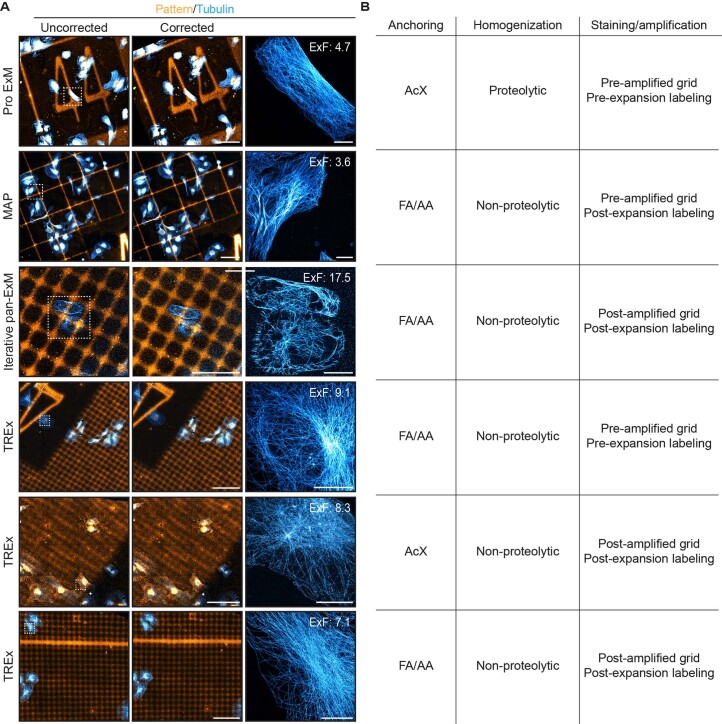
Extended Data Fig. 5. Compatibility of GelMap with common ExM variants.
a) Representative images of expanded cells cultured on GelMap grids and stained for tubulin (cyan) and myc (orange) using the indicated Expansion Microscopy variant and conditions. Uncorrected images show the result of linear transformation of the expanded image to a virtual reference grid, while corrected images show the result of non-linear transformation. Representative zooms are shown together with the expansion factor measured using GelMap. b) Table summarizing the different anchoring, homogenization and staining/amplification strategies. Scale bars: all scale bars 100 µm, iterative pan-ExM 50 µm, all zooms 10 µm. Scale bars in expanded samples reflect pre-expansion sizes.

