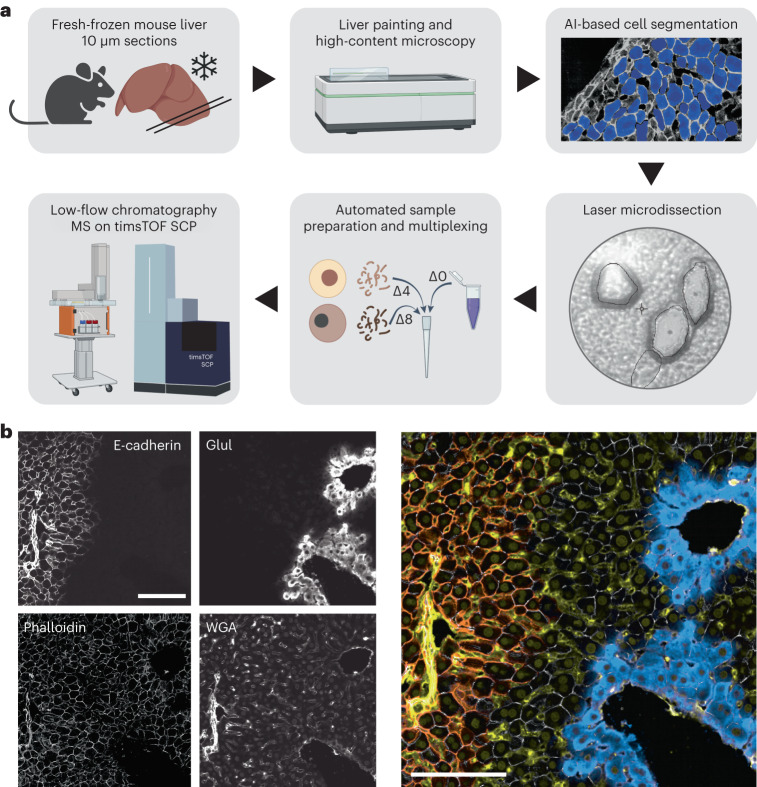
Fig. 1. Isolation and characterization of individual hepatocyte shapes in situ.
a, The scDVP workflow comprised embedding of fresh mouse liver tissue, staining and high-content microscopy, AI-guided hepatocyte segmentation, cutting and sorting of cells on a laser microdissection microscope, and peptide preparation with or without dimethyl labeling. The Δ0 channel contains the reference proteome and Δ4 and Δ8 contain two individual samples, which are all analyzed by ultra-high-sensitivity mass spectrometry. Created with BioRender.com. b, Liver painting with four stains. Left: E-cadherin marks PV regions, glutamate-ammonia ligase (Glul) surrounds the CV, the cell segmentation marker phalloidin, and the sinusoidal and nuclear counterstain WGA. Right: false color overlay of all channels: orange, E-cadherin; yellow, WGA, gray, phalloidin; turquoise, Glul. Scale bars, 100 μm.

