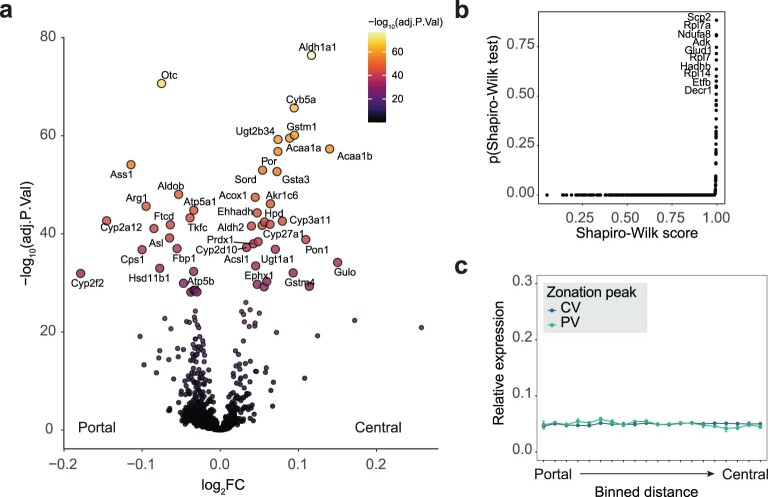
Extended Data Fig. 6. Functional analysis of single shape data.
a, Volcano plot after ANOVA across 20 spatially guided bins. Color overlay specifies adjusted p value, the top 40 significant proteins are labeled. b, Score and multiple testing-adjusted p value of a Shapiro-Wilk normality test. Lowest proteins are labeled. c, Relative expression normalized to 1 for each contributing protein (n = 10) of the least significant Shapiro-Wilk hits in b, from portal to central distance-guided bins.

