Figure 1.
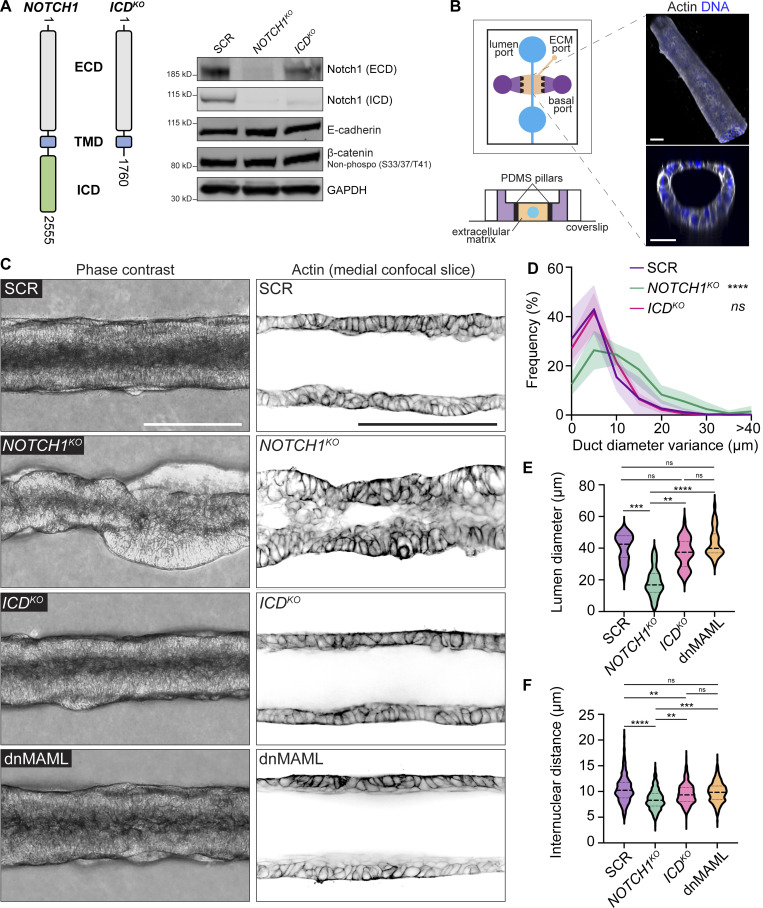
Notch1 influences the morphogenesis of an engineered ductal epithelium independent of ICD transcriptional signaling. (A) Left: Schematic of endogenous Notch1 CRISPR-Cas9 mutant used to truncate Notch1 ICD. Right: Western blot of lysates from scramble control (SCR), NOTCH1KO, and ICDKO MCF10A cells immunoblotted for Notch1 ECD, Notch1 ICD, E-cadherin, β-catenin (non-phosphorylated [S33/37/T41]), and GAPDH. (B) Left: Microfluidic platform consisting of an engineered 3D ductal epithelium embedded in physiologic ECM. Luminal ports (blue) used for cell seeding and perfusion of medium through the lumen, basal ports (purple) used for the delivery of medium containing growth factors, ECM injection port and ECM compartment (beige), PDMS pillars (black) used to contain hydrogel ECM (top schematic: top-down view; bottom schematic: cross-section). Right: Representative 3D oblique projection (top) and cross-section (bottom) of a 3D MCF10A duct labeled with phalloidin (white) and Hoechst (blue). Scale bars, 50 µm. (C) Left: Representative phase contrast micrographs of SCR, NOTCH1KO, ICDKO, and dnMAML ducts. Scale bar, 150 µm. Right: Representative medial confocal slice fluorescence micrographs of SCR, NOTCH1KO, ICDKO, and dnMAML ducts labeled with phalloidin (black). Scale bar, 100 µm. (D) Quantification of duct diameter variance measured from phase contrast micrographs as shown in C. n ≥ 7 independent ducts. (E) Quantification of lumen diameter measured from confocal micrographs of phalloidin as shown in C. Average lumen diameters from n ≥ 10 independent ducts. (F) Quantification of internuclear distances measured from confocal micrographs of Hoechst-labeled ducts. Average internuclear distance from n ≥ 7 independent ducts. Western blots are representative of three independent experiments. For all plots, mean ± SEM; one-way ANOVA with Tukey’s post-hoc test, **P < 0.01, ***P < 0.001, ****P < 0.0001, ns denotes non-significant. Source data are available for this figure: SourceData F1.

