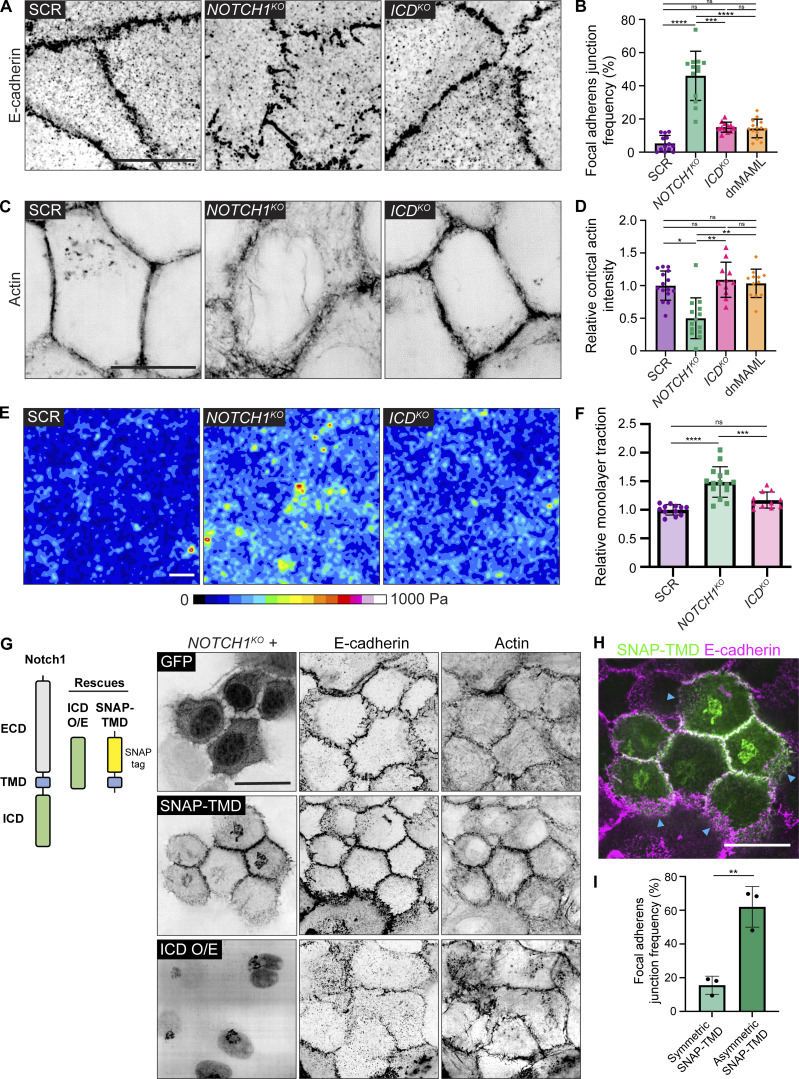
Figure 3.
Notch1 cortical signaling stabilizes adherens junctions and cortical actin. (A) Super-resolution by optical pixel reassignment (SoRa) fluorescence micrographs of scramble control (SCR), NOTCH1KO, and ICDKO cells immunostained for E-cadherin (black). Scale bar, 10 µm. (B) Quantification of the frequency of focal adherens junctions. n ≥ 12 fields of view from three independent experiments. (C) SoRa fluorescence micrographs of SCR, NOTCH1KO, and ICDKO cells labeled with phalloidin (black). Scale bar, 10 µm. (D) The intensity of cortical actin at cell–cell junctions, quantified from phalloidin-stained micrographs. n ≥ 12 fields of view from three independent experiments. (E) Traction force microscopy traction maps averaged from 10 fields of view from SCR, NOTCH1KO, and ICDKO cells. Scale bar, 20 µm. (F) Quantification of relative integrated monolayer tractions. n ≥ 11 traction force measurements from three independent experiments. (G) Left: Domain schematics of endogenous Notch1 and two rescue constructs utilized: Notch1 ICD overexpression (ICD O/E) and a N-terminal SNAP-tagged Notch1 TMD (SNAP-TMD). Right: Fluorescence micrographs of NOTCH1KO cells expressing transduction control GFP (top row), SNAP-TMD (middle row), or ICD O/E (bottom row). Cells were immunostained with E-cadherin (black) and labeled with phalloidin (black). Scale bar, 20 µm. (H) Fluorescence micrograph of NOTCH1KO cells expressing SNAP-TMD (green) and immunostained with E-cadherin (magenta). Blue arrows indicate junctions with asymmetric expression of SNAP-TMD. Scale bar, 20 µm. (I) Quantification of the frequency of focal adherens junctions in cells with symmetric expression of SNAP-TMD and asymmetric expression of SNAP-TMD. n ≥ 12 fields of view from three independent experiments. For plots B, D, and F, mean ± SEM; one-way ANOVA with Tukey’s post-hoc test, **P < 0.01, ***P < 0.001, ****P < 0.0001, ns denotes non-significant. For plot I, mean ± SEM; two-tailed unpaired t test, **P < 0.01.

