Figure 5.
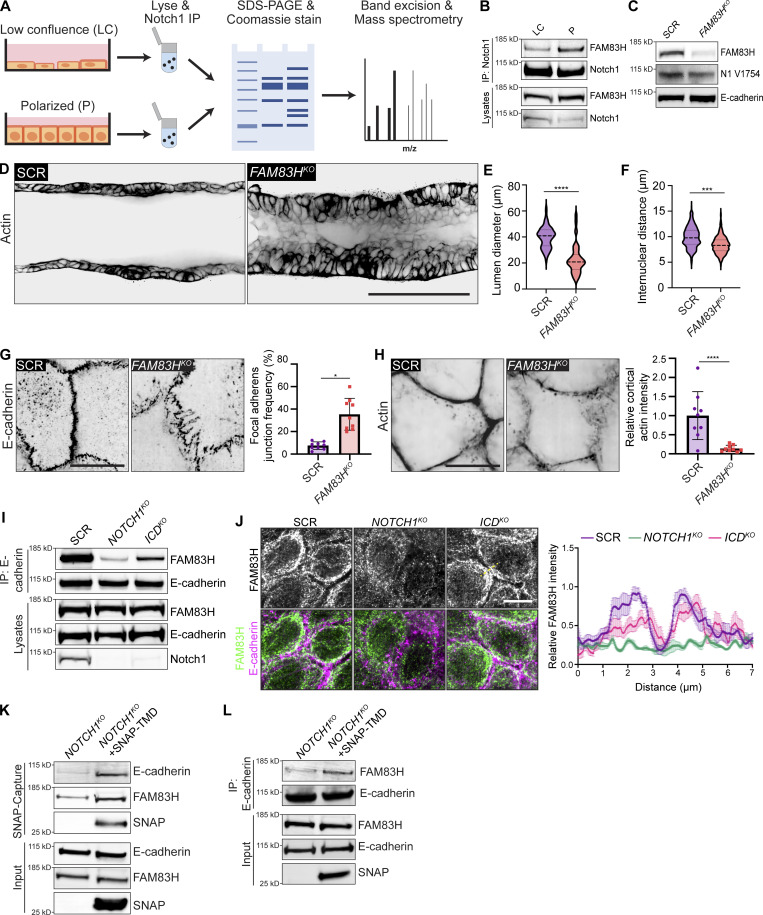
Notch1 cortical signaling functions through FAM83H to stabilize adherens junctions and regulate duct architecture. (A) Schematic of mass spectrometry workflow to identify monolayer state-dependent, differential Notch1 protein–protein interactions. (B) Western blot of immunoprecipitated Notch1 from low confluence (LC) or polarized (P) cells immunoblotted for FAM83H and Notch1. (C) Western blot of lysates from SCR or FAM83HKO cells immunoblotted for FAM83H, cleaved Notch1 V1754 (N1 V1754), and E-cadherin. (D) Representative medial confocal slice fluorescence micrographs of SCR and FAM83HKO ducts labeled with phalloidin (black). Scale bar, 100 µm. (E) Quantification of duct lumen diameter. Average lumen diameters from n ≥ 9 independent ducts. (F) Quantification of internuclear distances measured from Hoechst labeled ducts. Average internuclear distances from n ≥ 9 independent ducts. (G) Immunofluorescence micrographs of SCR and FAM83HKO cells immunostained with E-cadherin (black) and the corresponding quantification of the frequency of focal adherens junctions. Scale bar, 10 µm. n ≥ 9 fields of view from three independent experiments. (H) Fluorescence micrographs of SCR and FAM83HKO cells labeled with phalloidin (black) and the corresponding quantification of cell–cell junction cortical actin intensity. Scale bar, 10 µm. n ≥ 9 fields of view from three independent experiments. (I) Western blot of immunoprecipitation of E-cadherin from SCR, NOTCH1KO, and ICDKO cells immunoblotted for FAM83H and E-cadherin. (J) Left: Immunofluorescence micrographs of methanol fixed SCR, NOTCH1KO, and ICDKO cells immunostained with FAM83H (white, top row), and E-cadherin (magenta, bottom row). Scale bar, 10 µm. Right: Quantification of relative FAM83H intensity along a seven-micron line centered on and drawn orthogonal to cell–cell junctions of SCR, NOTCH1KO, and ICDKO cells (representative yellow dashed line). n = 6 junction profiles from three independent experiments. (K) Western blot of SNAP-Capture affinity purification from NOTCH1KO and NOTCH1KO + SNAP-TMD cells immunoblotted for E-cadherin, FAM83H, and SNAP. (L) Western blot of immunoprecipitation of E-cadherin from NOTCH1KO and NOTCH1KO + SNAP-TMD cells immunoblotted for E-cadherin, FAM83H, and SNAP. Western blots are representative of three independent experiments. For all plots, mean ± SEM; two-tailed unpaired t test, ***P < 0.001, ****P < 0.0001. Source data are available for this figure: SourceData F5.

