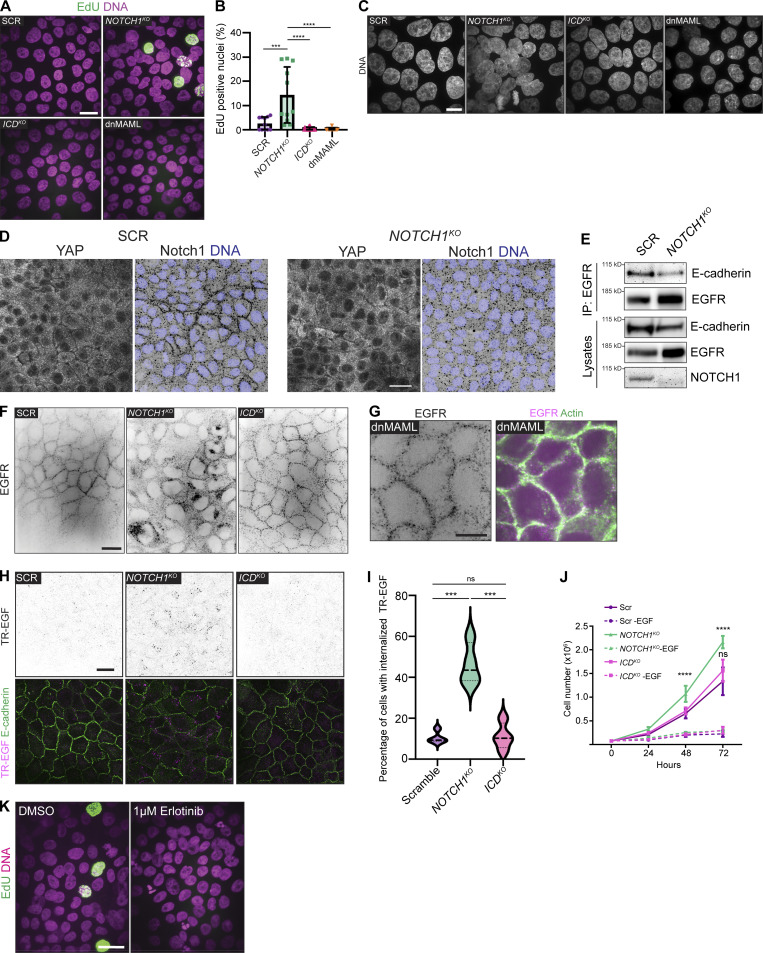
Figure S2.
Loss of Notch1 cortical signaling results in aberrant epithelial architecture and proliferation. (A) Fluorescence micrographs of scramble control (SCR), NOTCH1KO, ICDKO, and dnMAML cells labeled with EdU (green) and Hoechst (magenta). Scale bar, 20 µm. (B) Quantification of the percentage of EdU-positive nuclei in SCR, NOTCH1KO, ICDKO, and dnMAML cells. n ≥ 12 fields of view, from three independent experiments. (C) Maximum intensity projection fluorescence micrographs of SCR, NOTCH1KO, ICDKO, and dnMAML cells labeled with Hoechst (grey). Scale bar, 10 µm. (D) Immunofluorescence micrographs of SCR and NOTCH1KO cells immunostained for YAP (white, left) and Notch1 (black, right) and labeled with DAPI (blue, right). Scale bar, 20 µm. (E) Western blot of immunoprecipitation of EGFR from SCR and NOTCH1KO cell lysates immunoblotted for E-cadherin and EGFR. Representative of three independent experiments. (F) Full field of view source fluorescence micrographs of SCR, NOTCH1KO, and ICDKO cells immunostained for EGFR (black) for representative images in Fig. 2. Scale bar, 20 µm. (G) Fluorescence micrographs of dnMAML cells immunostained for EGFR (black, left; magenta, right) and labeled with phalloidin (green, right). Scale bar, 10 µm. (H) Top: Fluorescence micrographs of SCR, NOTCH1KO, and ICDKO cells incubated with TexasRed-EGF (TR-EGF; black). Bottom: Fluorescence micrographs of SCR, NOTCH1KO, and ICDKO cells incubated with TR-EGF (magenta) and labeled with phalloidin (green). Scale bar, 20 µm. (I) Quantification of the percentage of SCR, NOTCH1KO, and ICDKO cells with internalized TR-EGF. Average internalization from n = 4 independent experiments. (J) Cell proliferation rates of SCR, NOTCH1KO, and ICDKO cells treated with and without EGF over a 3-d timecourse. n = 3 independent experiments. (K) Fluorescence micrographs of NOTCH1KO cells treated with DMSO or 1 µM Erlotinib labeled with EdU (green) and Hoechst (pink). Scale bar, 20 µm. For plots B, I, and J, mean ± SEM; one-way ANOVA with Tukey’s post-hoc test, ***P < 0.001, ****P < 0.0001, ns denotes non-significant. Source data are available for this figure: SourceData FS2.

