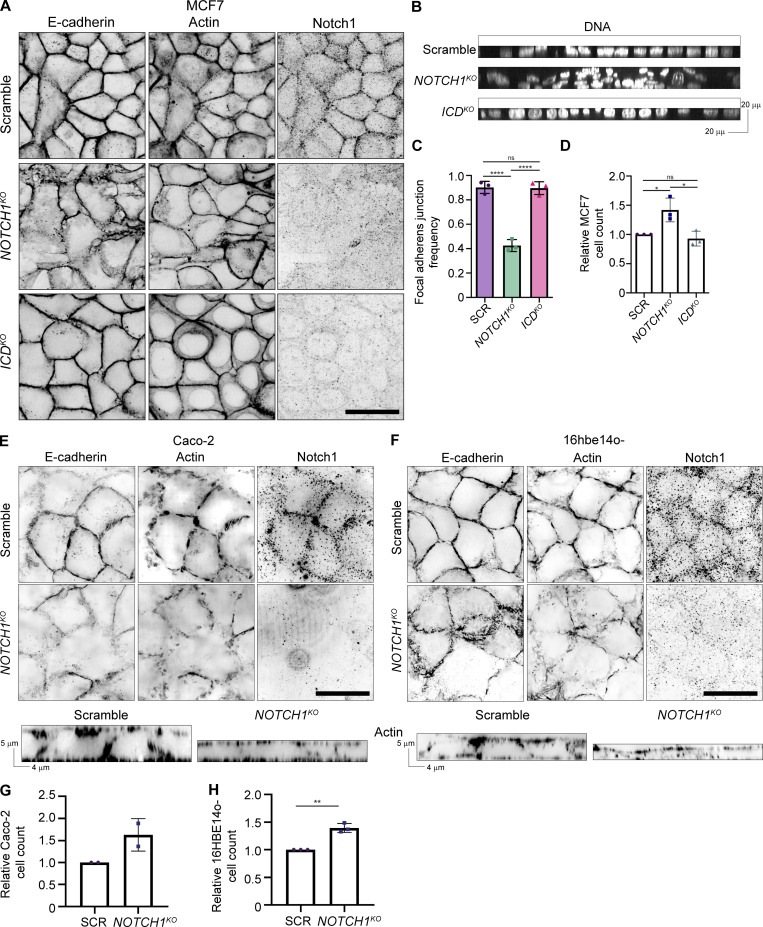
Figure S3.
Notch1 regulates epithelial architecture, adherens junctions, cortical actin organization, and proliferation in human epithelia. (A) Immunofluorescence micrographs of Scramble, NOTCH1KO, and ICDKO MCF7 cells immunostained for E-cadherin (black) and Notch1 (black) and labeled with phalloidin (black). Scale bar, 20 µm. (B) YZ orthogonal projections from micrographs of Scramble, NOTCH1KO, and ICDKO MCF7 cells labeled with Hoechst (white). (C) Quantification of the frequency of focal adherens junctions in scramble control (SCR), NOTCH1KO, and ICDKO MCF7 cells. n ≥ 12 fields of view from three independent experiments. (D) Relative number of SCR, NOTCH1KO, and ICDKO MCF7 cells measured at passage. n = 3 independent experiments. (E) Top: Immunofluorescence micrographs of Scramble (top row) and NOTCH1KO (bottom row) Caco-2 cells immunostained for E-cadherin (black) and Notch1 (black) and labeled with phalloidin (black). Scale bar, 20 µm. Bottom: YZ orthogonal projections from micrographs of Scramble and NOTCH1KO Caco-2 cells labeled with phalloidin (black). (F) Top: Fluorescence micrographs of Scramble (top row) and NOTCH1KO (bottom row) 16hbe14o- cells immunostained for E-cadherin (black) and Notch1 (black) and labeled with phalloidin (black). Scale bar, 20 µm. Bottom: YZ orthogonal projections from micrographs of Scramble and NOTCH1KO 16hbe14o- cells labeled with phalloidin (black). (G) Relative number of SCR and NOTCH1KO Caco-2 cells measured at passage. n = 2 independent experiments. (H) Relative number of SCR and NOTCH1KO 16hbe14o- cells measured at passage. n = 3 independent experiments. For plots C and D, mean ± SEM; one-way ANOVA with Tukey’s post-hoc test, *P < 0.05, ****P < 0.0001, ns denotes non-significant. For plot H, mean ± SEM; two-tailed unpaired t test, **P < 0.01.

