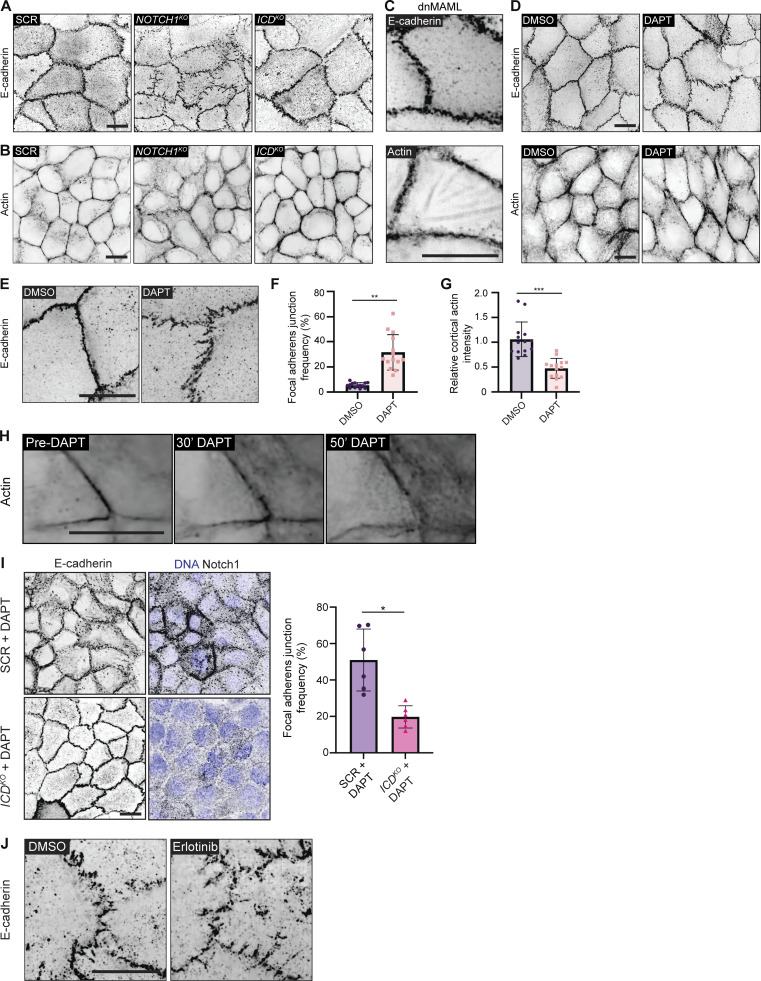
Figure S4.
Loss of Notch1 cortical signaling disrupts epithelial adherens junctions and cortical actin organization. (A) Source full field of view fluorescence micrographs of scramble control (SCR), NOTCH1KO, ICDKO, and dnMAML cells immunostained for E-cadherin (black) for representative images in Fig. 3. (B) Source full field of view fluorescence micrographs of SCR, NOTCH1KO, ICDKO, and dnMAML cells labeled with phalloidin (black) for representative images in Fig. 3. (C) SoRa fluorescence micrographs of dnMAML cells labeled with E-cadherin (black) or phalloidin (black). Scale bar, 10 µm. (D) Source full field of view fluorescence micrographs of wild type cells treated with DMSO or 10 µM DAPT for 2 h immunostained for E-cadherin (black, top row) and labeled with phalloidin (black, bottom row) for representative images in D. (E) Fluorescence micrographs of wild type cells treated with DMSO or 10 µM DAPT for 2 h and immunostained with E-cadherin (black). Scale bar, 10 µm. (F) Quantification of the frequency of focal adherens junctions in DMSO and DAPT treated cells. n ≥ 13 fields of view from three independent experiments. (G) Intensity of cortical actin at cell–cell junctions, quantified from phalloidin-stained micrographs of DMSO and DAPT treated cells. n ≥ 13 fields of view from three independent experiments. (H) Fluorescence micrographs of single frames from a timelapse movie of wild type cells labeled with SPY650-FastAct (black) and treated with 10 µM DAPT. (I) Left: Fluorescence micrographs of SCR cells or ICDKO cells treated with 10 µM DAPT for 2 h, immunostained for E-cadherin (black), and Notch1 (black) and labeled with Hoechst (blue). Right: Quantification of the frequency of focal adherens junctions in SCR + DAPT and ICDKO + DAPT treated cells. n = 6 fields of view from three independent experiments. (J) Immunofluorescence micrographs of NOTCH1KO cells treated with DMSO or 1 µM Erlotinib immunostained for E-cadherin (black). All scale bars, 10 µm. For plots F, G, and I, mean ± SEM; two-tailed unpaired t test, *P < 0.05, **P < 0.01, ****P < 0.0001.

