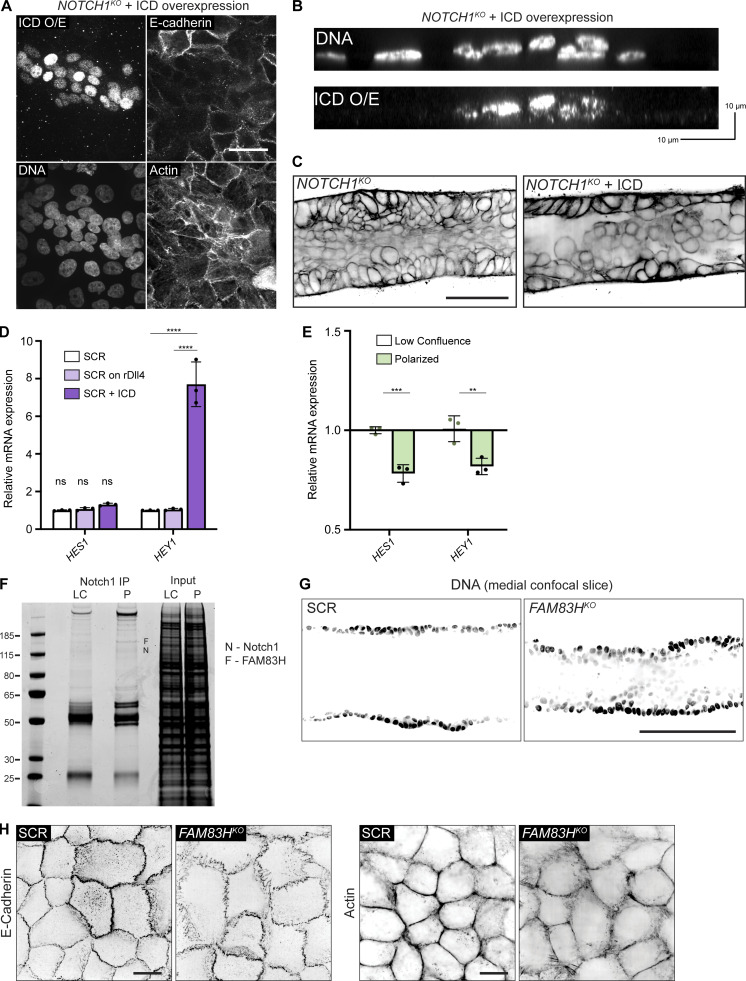
Figure S5.
Overexpression of the Notch1 ICD does not rescue the NOTCH1KO phenotype; loss of FAM83H leads to focal adherens junctions, depleted cortical actin, and alterations in ductal architecture. (A) Fluorescence micrographs of NOTCH1KO cells overexpressing Notch1 ICD (ICD O/E) immunostained for Notch1 ICD (white), E-cadherin (white), and labeled with Hoechst (white) and phalloidin (white). Scale bar, 20 µm. (B) YZ orthogonal projections from micrographs of NOTCH1KO cells overexpressing Notch1 ICD (ICD O/E) labeled with Hoechst (white). (C) Medial confocal slice micrographs from NOTCH1KO and NOTCH1KO cells expressing Notch1 ICD labeled with phalloidin (black). Scale bar, 50 µm. (D) mRNA expression of Notch1 target genes HES1 and HEY1 measured by qPCR in scramble control (SCR), SCR cells plated on recombinant Dll4 (rDll4), and SCR cells overexpressing Notch1 ICD. Average qPCR reads from n = 3 independent experiments. (E) Expression of Notch1-target genes HES1 and HEY1 measured by qPCR in low confluence and polarized wild type MCF10A. Average qPCR reads from n = 3 independent experiments. For plot D, mean ± SEM; one-way ANOVA with Tukey’s post-hoc test, ****P < 0.0001, ns denotes non-significant. For plot E, mean ± SEM; two-tailed unpaired t test, **P < 0.01, ***P < 0.001. (F) Representative Coomassie stained SDS-PAGE gel of Notch1 immunoprecipitation from LC and P cells. F denotes the band identified as FAM83H by mass spectrometry. (G) Medial confocal slice micrographs of SCR and FAM83HKO ducts labeled with Hoechst (black). Scale bar, 100 µm. (H) Source full field of view fluorescence micrographs of SCR and FAM83HKO cells stained with E-cadherin (black, top row) and labeled with phalloidin (black, bottom row) for representative images in Fig. 5. Scale bars, 10 µm. Source data are available for this figure: SourceData FS5.

