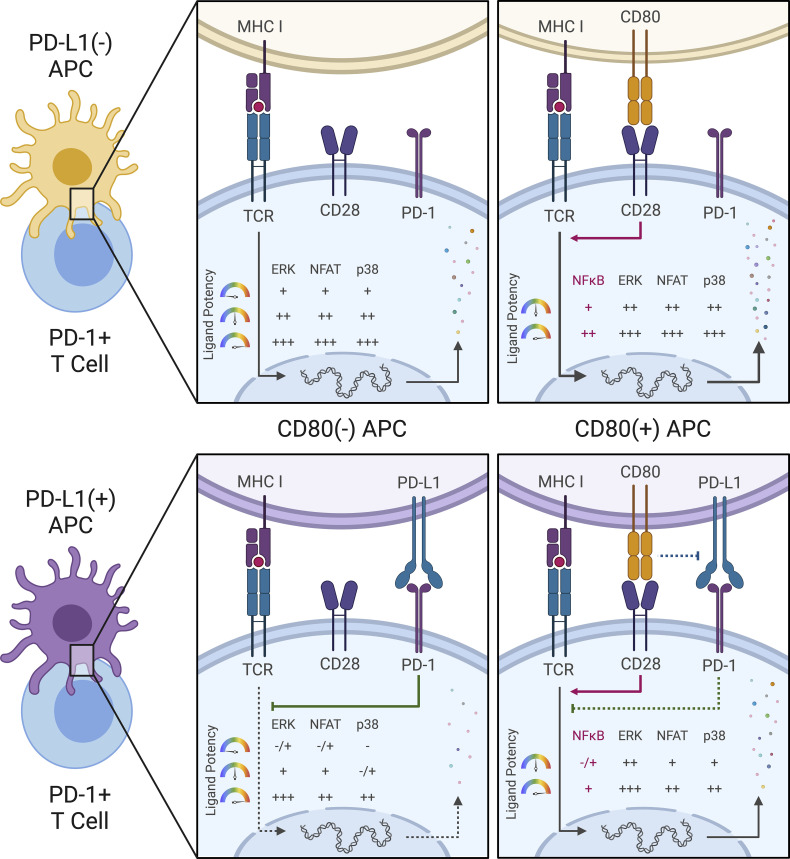
PD-1 engagement by T cells inhibits distinct antigen-evoked signals in a nonlinear manner, strongly influenced by the nature of available TCR ligands.
Abstract
Checkpoint blockade revolutionized cancer therapy, but we still lack a quantitative, mechanistic understanding of how inhibitory receptors affect diverse signaling pathways. To address this issue, we developed and applied a fluorescent intracellular live multiplex signal transduction activity reporter (FILMSTAR) system to analyze PD-1-induced suppressive effects. These studies identified pathways triggered solely by TCR or requiring both TCR and CD28 inputs. Using presenting cells differing in PD-L1 and CD80 expression while displaying TCR ligands of distinct potency, we found that PD-1-mediated inhibition primarily targets TCR-linked signals in a manner highly sensitive to peptide ligand quality. These findings help resolve discrepancies in existing data about the site(s) of PD-1 inhibition in T cells while emphasizing the importance of neoantigen potency in controlling the effects of checkpoint therapy.
Graphical Abstract
Introduction
The two-signal model for T cell activation (Bretscher and Cohn, 1970; Lenschow et al., 1996; Bretscher, 1999) has had a profound influence on immunological thought, and decades of studies have confirmed the central tenet of this model, namely that both an antigen-specific and a separate antigen-unspecific signal need to be delivered simultaneously to T cells to obtain full activation and effector cell development. The antigen-specific input arises by engagement of the clonotypic T cell receptor (TCR) with its ligand, which for conventional αβ CD4 and CD8 T cells is typically a peptide bound to a major histocompatibility complex-encoded class I or class II molecule (pMHC) on the surface of another cell (antigen-presenting cells, or APC). The second signal that has been best characterized as critical for naive T cell activation is delivered by CD28 interacting with its ligands CD80 and CD86, again on another cell surface.
While this two-signal model is well established in functional terms, the actual biochemical and molecular genetic basis for the requirement is less clearly worked out. Some studies examining gene transcripts (Diehn et al., 2002) suggested that CD28 input merely amplifies the effects of TCR signaling rather than contributing unique signals, as would be expected by the two-signal model, whereas other findings (Marinari et al., 2004; Pagès et al., 1994) indicated that major gene activation events associated with T cell priming depend on distinct biochemical contributions made by the two receptors. In this regard, initiation of transcription of many of the genes associated with T cell blast transformation, proliferation, epigenetic remodeling, and cytokine production depends on a combination of activated transcription factors, but the degree to which TCR versus CD28 engagement provides each of these needed factors is debated. The capacity of TCR signaling alone to evoke calcium flux via a pathway linked to PLCγ has been well documented, and this calcium rise is essential for dephosphorylation and nuclear translocation of NFAT transcription factors (Macian, 2005). Likewise, TCR engagement operates via Grb2 and SOS to trigger MAPK responses, particularly ERK phosphorylation (Hwang et al., 2020). The precise steps connecting the TCR to other MAPK pathways such as JNK and p38 or to the development of NFκB activity are less well established, while CD28 engagement is most often associated with PI3K-AKT signaling (Pagès et al., 1994; Chemnitz et al., 2004) and mTOR activation (Hamilton et al., 2014; Zheng et al., 2009).
These unresolved issues bear directly on the use of antibodies as checkpoint inhibitors for cancer immunotherapy. Anti-CTLA-4 treatment affects the extent of CD28 engagement by CD80 and CD86 by preventing Treg trogocytosis of these costimulatory proteins (Wing et al., 2008; Qureshi et al., 2011) or the autoinhibition of T cell activation by CTLA-4 expressed on stimulated T cells (Rudd et al., 2009). The mechanism of action of anti-PD-1/PD-L1 is less clear. Early studies (Yokosuka et al., 2012; Sheppard et al., 2004; Latchman et al., 2001) provided evidence for a direct effect of PD-1 on TCR signaling via SHP-2 recruitment and dephosphorylation of proximal TCR signaling molecules. Several other reports (Mizuno et al., 2019; Fife et al., 2009; Celis-Gutierrez et al., 2019; Shimizu et al., 2020) are consistent with this concept of a TCR-directed effect of PD-1 inhibition, including our own work (Honda et al., 2014) on CD4+ T cell dynamics in acutely inflamed sites. However, other recent reports (Hui et al., 2017; Kamphorst et al., 2017) have provided data suggesting that the CD28 pathway is the preferred target of PD-1 inhibition, with a lesser effect on TCR signaling. The picture is further complicated by evidence (Horn et al., 2018; Chaudhri et al., 2018; Sugiura et al., 2019; Zhao et al., 2019) that CD80 but not CD86 can interact with PD-L1 in cis, blocking the site of PD-L1 interaction with PD-1 while leaving the CD28 binding face of CD80 available. Thus, coexpression of CD80 and PD-L1 could affect both the TCR and CD28 inputs to the T cell and treatment with checkpoint inhibitor antibodies could likewise affect both receptor systems. It is also not easy to untangle whether PD-1 acts preferentially and directly on low-affinity pMHC-TCR engagements as reported (Shimizu et al., 2021) because CD28 costimulation amplifies weak TCR inputs, or alternatively, if PD-1 interferes with the CD28 amplification required for responses to weak TCR ligands.
Here, we have developed the fluorescent intracellular live multiplex signal transduction activity reporter (FILMSTAR) system to attempt to resolve these questions in a quantitative manner by probing each of several key downstream signaling events in the Jurkat model human T cell. The method enables single-cell, real-time, quantitative, dynamic measurement of the ERK, NFAT, NFκB, p38, and JNK pathways and does so using human TCRs (Sibener et al., 2018) with well-characterized, natural, and engineered pMHC ligands whose potencies vary over orders of magnitude. By engineering the APC as well as the responding Jurkat T cells, it was possible to cleanly delineate which signaling pathways are solely dependent on the TCR versus CD28 receptor, which required conjoint inputs from both molecules, and the effect of ligand potency and amount on the capacity of PD-1 to inhibit the various downstream signaling responses. These data provided strong evidence for the conclusion that PD-1 acts primarily via inhibition of TCR signaling, a key finding validated using primary human T cells, with the extent of repression of specific downstream pathways determined by the strength of the TCR engagement. Our study provides a new approach to the analysis of T cell activation and signaling whose use reveals the variations in checkpoint blockade effects that ensue when T cells are responding to a diverse array of ligands of different potency, as would be the case in most tumors. Because these differential effects are not all or none but lead to changes in the proportional activity of different transcription factors, the outcome of checkpoint therapy will be a complex mix of gain of response and changes in the quality of those responses.
Results
A translocation-based FILMSTAR expression system
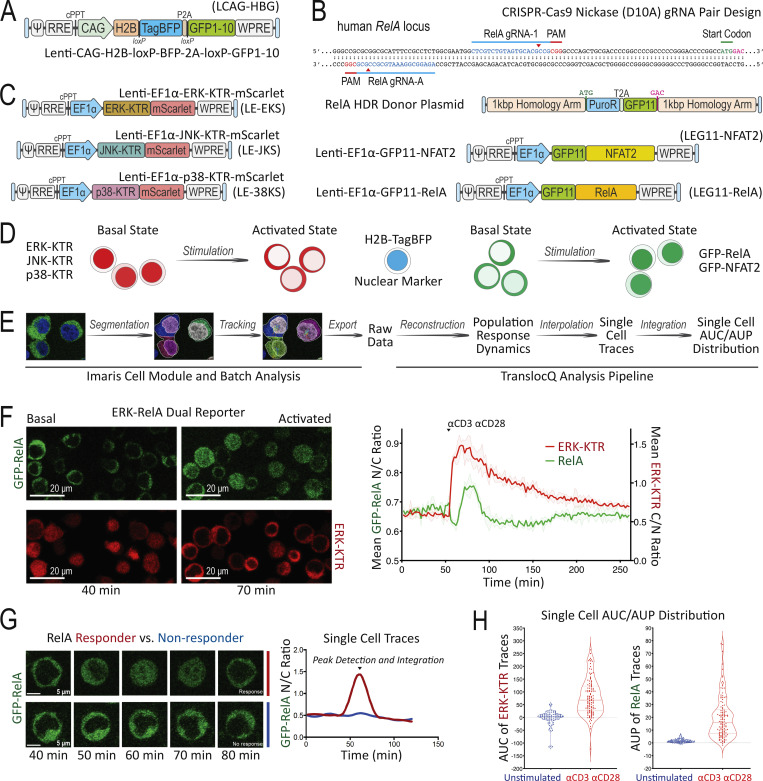
To develop a method that can simultaneously probe multiple intracellular signaling pathways in individual T cells in real time, we relied on the principle that nuclear translocation of transcription factors or their biochemical modifiers is promoted by a diverse array of extracellular stimuli. This led us to create a set of Jurkat human leukemia T cells that would enable dynamic live-cell imaging of such translocation events at the single-cell level. To define the nuclear compartment in live T cells, the Jurkat parental line was engineered by lentiviral transduction (Fig. 1 A) to express the histone H2B-TagBFP nuclear reporter protein and a non-fluorescent GFP1-10 protein fragment that enables detection of GFP11-tagged molecules via split-GFP complementation (TagBFP+ GFP1-10+ Jurkat; Cabantous et al., 2013). Using an efficient CRISPR-Cas9n (Cas9-D10A nickase)-HDR (homology-directed repair) genome engineering method described previously (Chan et al., 2021), these TagBFP+ GFP1-10+ Jurkat cells were modified to express GFP11-tagged RelA from the endogenous loci (Fig. 1 B), yielding a GFP-p65 canonical NFκB reporter cell line. For experiments that required improved signal to noise ratio, we transduced the TagBFP+ GFP1-10+ Jurkat to express higher amounts of GFP11-RelA (Fig. 1 B). Using the same split-GFP complementation approach, TagBFP+ GFP1-10+ Jurkat cells were independently transduced to create a GFP-NFAT2 translocation reporter cell line (Fig. 1 B). To report the live cell dynamics of MAPK activation, including the ERK, JNK, and p38 pathways, we employed the kinase translocation reporter (KTR) technology (Regot et al., 2014) with an mScarlet fluorescent protein (Fig. 1 C) to generate dual pathway reporter Jurkat cell lines with various combinations of MAPK-KTR-mScarlet and GFP-tagged nuclear factor expression, enabling simultaneous monitoring of distinct signaling events using live cell fluorescent protein translocation imaging (Fig. 1 D). The far-red fluorescence channel was reserved for cell surface marker staining, magnetic cell separation (MACS)–based purification, and additional reporter staining such as promoter-induced tEGFR or tNGFR expression.
Figure 1.
Development of the Jurkat FILMSTAR system and image data quantification workflow. (A) LCAG-HBG lentiviral vector design for stable expression of H2B-TagBFP and GFP1-10. (B) CRISPR-Cas9n–mediated HDR design for GFP11 knock-in at endogenous human RelA genomic loci versus LEG11-NFAT2 or LEG11-RelA lentiviral expression vector design. (C) Stable KTR expression mediated by the LE-EKS, LE-JKS, or LE-38KS lentiviral vector. (D) Schematic diagram comparing basal versus activated state of cells in the Jurkat FILMSTAR system. (E) Image data analysis workflow following live cell confocal time-lapse fluorescence microscopy. (F) Population response curves (mean ± standard deviation [s.d.]) showing ERK-KTR versus RelA activation dynamics following αCD3/αCD28 antibody stimulation. Image snapshots represent basal (40 min) versus activated state (70 min) of the ERK-KTR-mScarlet versus the GFP-RelA reporter. Scale bar = 20 μm. (G) Single-cell traces comparing RelA translocation dynamics between a responding (red) versus a non-responding (blue) T cell following PMA/ionomycin stimulation added at 40 min. Image snapshots show GFP-RelA localization of the corresponding single cell between 40 and 80 min. Scale bar = 5 μm. (H) Violin plots showing TranslocQ single-cell quantification results using the AUC or the AUP analysis. Median and quartiles are indicated by dashed and dotted lines, respectively.
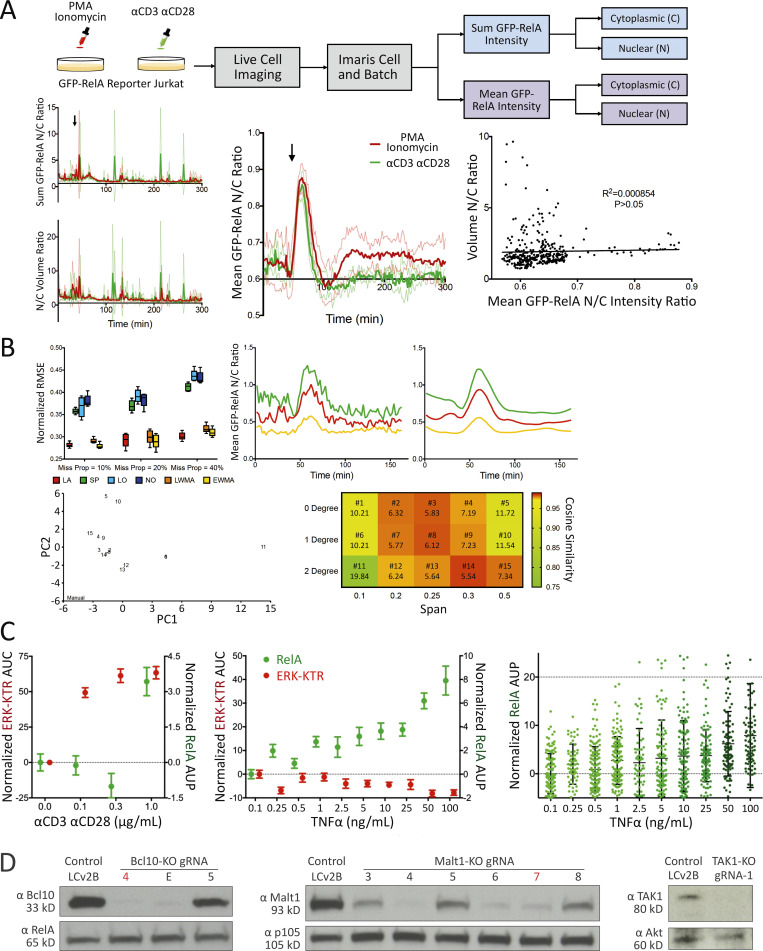
Live cell confocal time-lapse imaging experiments generate a large amount of raw data that often require customized tools in addition to existing software packages to yield quantitative results. To achieve a streamlined and unbiased workflow to quantify nuclear versus cytoplasmic reporter protein localization, we developed an image analysis package called TranslocQ (Fig. 1 E). This analysis pipeline can convert raw imaging data into population response curves (Fig. 1 F and Fig. S1 A), single-cell traces (Fig. 1 G and Fig. S1 B), and single-cell area under curve (AUC) or area under peak (AUP) distributions (Fig. 1 H). As proof of principle experiments, we stimulated the ERK-RelA dual reporter Jurkat cells with αCD3/αCD28 antibodies (Fig. 1, F and H) or PMA/ionomycin (Fig. 1 G) and analyzed the imaging data with the Imaris and TranslocQ workflow (Fig. 1 E). Population response curves (Fig. 1 F) generated by this workflow quantitatively summarized hours of confocal time-lapse images and recapitulated the signal pathway activation dynamics described previously (Blonska et al., 2007). With high temporal resolution, these response curves clearly revealed differences between ERK and RelA activation dynamics upon αCD3/αCD28 stimulation as well as substantial intraclonal heterogeneity in response (Fig. 1, F and H). Each population response curve consists of dozens of individual cell traces (Fig. 1 G and Fig. 2 A) that can be further processed by TranslocQ to obtain AUC or AUP data. Single-cell AUC or AUP distributions generated by time integration quantify both the magnitude and duration of translocation events within a customizable analysis time window and reflect a wide variety of transcription factor activation levels in individual cells (Fig. 1 H).
Figure S1.
TranslocQ image analysis pipelines, αCD3/αCD28 or TNFα titration data, and protein expression analysis for BCL10, MALT1, and TAK1. (A) Mean GFP nuclear to cytoplasmic intensity ratio recapitulates RelA nuclear translocation dynamics. Population response to PMA/ionomycin (red) or αCD3/αCD28 (green) stimulation calculated from GFP-RelA reporter Jurkat single-cell N/C ratio of sum GFP intensity (top left), mean GFP intensity (middle), or N/C volume ratio. Shown are mean ± s.d. of the population response at three imaging positions for each stimulation added at the indicated time point (arrow). Correlation between volume N/C ratio and GFP-RelA mean intensity N/C ratio (right). Statistical significance and coefficient of determination were calculated using a Pearson correlation test (P > 0.05). (B) Missing value interpolation and the smoothing function enable the execution of peak detection. Comparison of missing value interpolation methods at different missing data proportions using the dataset that contains 200 complete single-cell traces (top left). Shown are mean (±s.d.) of normalized root mean square error (n = 5). Representative traces for active single cells (top right) before and after smoothing with LOESS (degree = 1, span = 0.25). PCA (bottom left) of single-cell classification performed with manual observation and TranslocQ. For each method, the number of cells classified into each category (active, semi-active, inactive) at each position were considered (n = 3). Quantification accuracy of TranslocQ with different parameter sets (bottom right), represented by the cosine similarity with manual measurement. Euclidean distance to the manual data point in the PCA table is shown along with the parameter set number. (C) ERK-KTR versus NFκB-RelA dose responses to αCD3/αCD28 or TNFα. Shown are the AUP (mean ± standard error of the mean [s.e.m.]) of single-cell N/C GFP-RelA (in green) or the AUC (mean ± s.e.m.) of single-cell C/N ERK-KTR-mScarlet (in red) traces. Dose responses of RelA to TNFα titration are also shown as single-cell AUP distribution, along with the corresponding mean ± s.d. error bar. Results are representative of three technical replicates. (D) CRISPR/Cas9-mediated KO efficiency of BCL10, MALT1, and TAK1 assessed by Western blot analysis. The gRNA selected for use in Fig. 2B is highlighted for BCL10-KO (gRNA-4 in red) or MALT1-KO (gRNA-7 in red). Source data are available for this figure: SourceData FS1.
Figure 2.
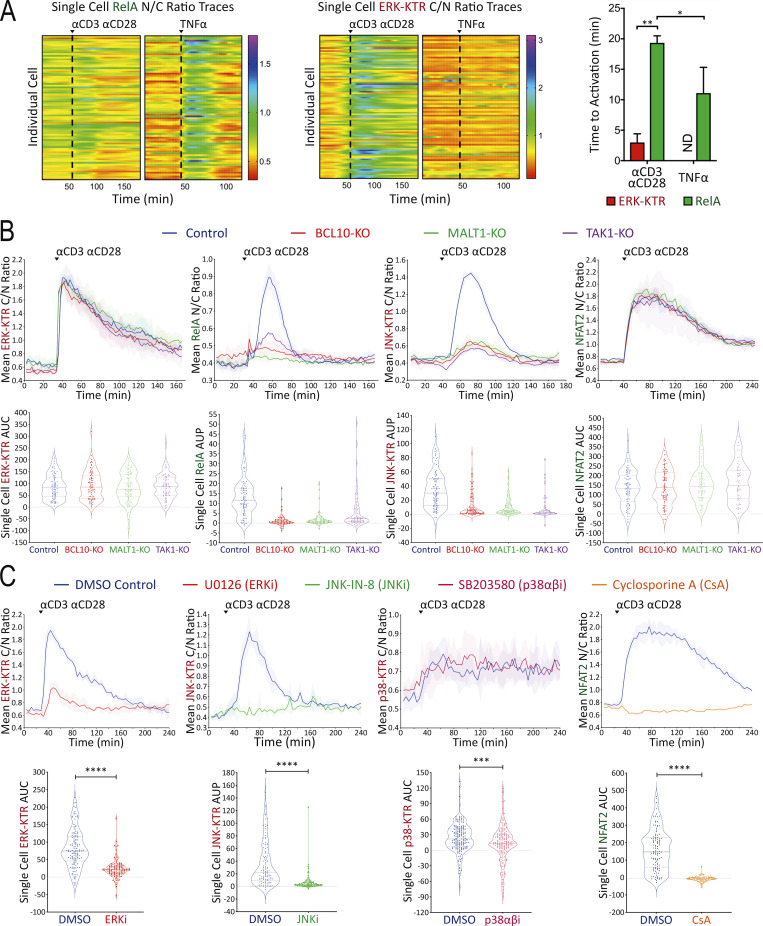
Assessment of reporter specificity, image data processing, and TranslocQ compatibility. (A) Single-cell ERK-KTR versus RelA responses to αCD3/αCD28 versus TNFα stimulation added at the time point indicated by the dashed line. Time to activation (shown as population mean + s.d.) represents the time from adding stimulation to reporter translocation peaks. **P value <0.01, *P value <0.05, Mann–Whitney U test. ND, not determined. Results are representative of >3 independent experiments. (B and C) Population response curves (mean ± s.d.) versus single-cell AUC/AUP distributions (violin plots with median and quartiles) comparing the indicated CRISPR-KO or (C) chemical inhibitor conditions following αCD3/αCD28 antibody stimulation added at the indicated time point. ***P value between 0.0001 and 0.001, ****P value <0.0001, two-tailed unpaired t test. Results are representative of three independent experiments in B or two independent experiments in C.
Assessment of reporter specificity and image data analysis workflow
Using this new set of Jurkat FILMSTAR cells and the TranslocQ analytical package, we conducted a series of experiments to validate the specificity of various reporter lines and our ability to quantify cellular responses to various stimulation conditions. Initial studies revealed differences in ERK versus RelA activation dynamics. To study this behavior further, we stimulated reporter Jurkat T cells with either αCD3/αCD28 antibodies or human TNFα recombinant protein. Unlike CD3/CD28 receptor stimulation that activates both ERK and RelA signaling pathways (Fig. 1 F and Fig. S1 C), TNF receptor stimulation induced more rapid and robust RelA nuclear translocation but showed little evidence of ERK signal transduction (Fig. 2 A and Fig. S1 C). Consistent with a previous report (Pomerantz et al., 2002), these data confirmed the specificity of both ERK-KTR and RelA reporters, while documenting the dynamic range and versatility of the ERK-RelA dual reporter Jurkat cell line.
We extended our image analysis workflow (Fig. 1 E) to the JNK-KTR, p38-KTR, and NFAT2 live cell Jurkat reporters and tested their specificity by genetic knockout (KO; Fig. 2 B) or chemical inhibitor (Fig. 2 C) approaches. A lentivirus-based CRISPR/Cas9 method (Chan et al., 2021) was used to eliminate expression of the BCL10, MALT1, or TAK1 signaling adapter proteins that play critical roles in NFκB and JNK pathways downstream of antigen receptor engagement (Blonska et al., 2007; Yang et al., 2016; Chan et al., 2013). Following Western blot analysis to assess CRISPR/Cas9 KO efficiency (Fig. S1 D), gene-edited reporter Jurkat cell lines were stimulated with αCD3/αCD28 antibodies to determine signal pathway dependency on BCL10, MALT1, or TAK1 protein expression (Fig. 2 B). As expected, CD3/CD28 receptor stimulation induced RelA and JNK but not ERK and NFAT2 responses in a BCL10, MALT1, and TAK1-dependent manner (Fig. 2 B). Chemical inhibitor pretreatment significantly reduced ERK, JNK, p38, or NFAT2 reporter translocation following αCD3/αCD28 stimulation (Fig. 2 C) in accord with the expected specificity of the inhibitors.
Mapping of signaling pathways triggered by TCR-CD3 versus CD28 receptor engagement
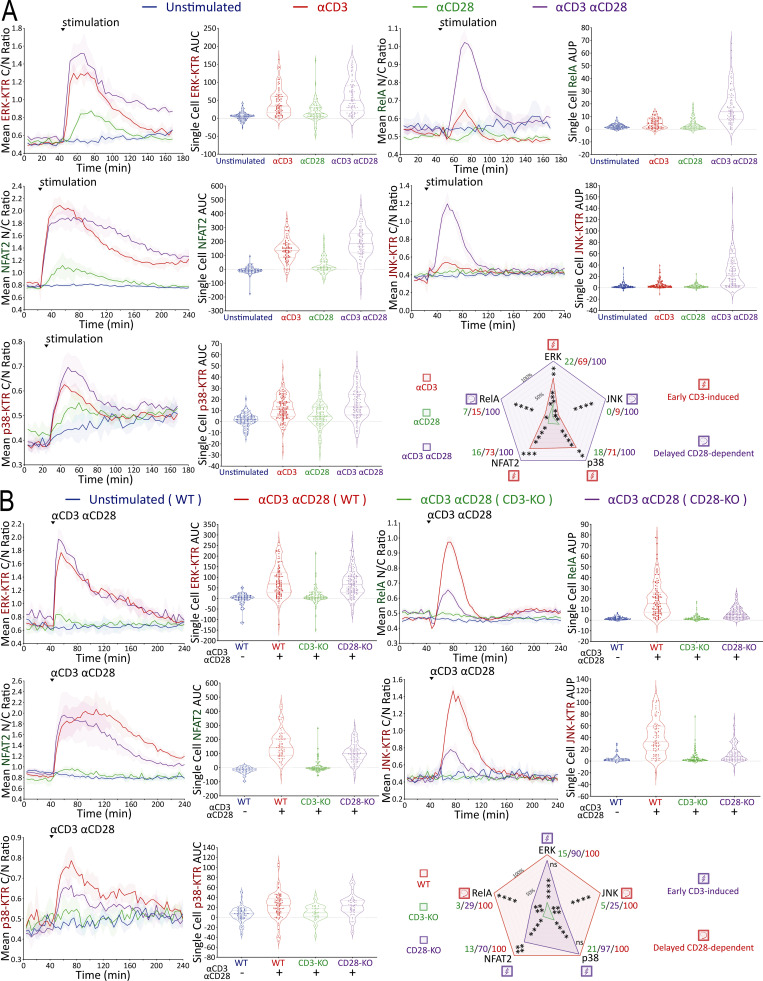
With this new multiplex, real-time signaling analysis system in hand, we first sought to dissect the downstream signaling evoked by CD3 versus CD28 receptor engagement, comparing MAPK, NFκB, and NFAT signaling profiles among αCD3, αCD28, and αCD3+αCD28 antibody stimulation conditions (Fig. 3 A). CD3 receptor engagement rapidly induced substantial ERK, NFAT2, and p38 activities, while αCD28-induced receptor engagement very weakly activated these pathways. RelA and JNK activation differed from the results observed with ERK, NFAT2, and p38, requiring inputs from both CD3 and CD28 receptors while exhibiting a delayed on/rapid off response pattern, as compared with the early on/gradual off pattern of ERK and NFAT2 (Fig. 3 A). To examine whether antibody crosslinking led to a low level of mixed receptor signaling due to the presence of both TCR-CD3 and CD28 in membrane microdomains or clusters (Yokosuka et al., 2008; Zumerle et al., 2017), we created CD3-KO or CD28-KO Jurkat FILMSTAR lines via CRISPR/Cas9 (Fig. S2 A). Stimulation of CD3-KO or CD28-KO reporter Jurkat cells with αCD3/αCD28 antibodies showed that the small signals for ERK, NFAT2, and p38 seen with αCD28 antibody alone (Fig. 3 A) were lost in CD3-KO reporter cells (Fig. 3 B). These data suggest caution in the interpretation of a large literature based on use of αCD28 antibody to assess signaling through that surface molecule, as these data indicate that it is the coengagement of the TCR-CD3 complex that generates or contributes to the biochemical signals observed.
Figure 3.
Mapping of signaling events induced by CD3 versus CD28 receptor engagement. (A and B) Population response curves (mean ± s.d.) versus single-cell AUC/AUP distributions (violin plots with median and quartiles) comparing the indicated αCD3 versus αCD28 antibody stimulation or (B) CRISPR-induced CD3-KO versus CD28-KO condition following αCD3/αCD28 antibody stimulation added at the indicated time point. Radar plots represent normalized mean values of corresponding single-cell AUC/AUP distributions. ns: P value ≥0.05, *P value between 0.01 and 0.05, **P value between 0.001 and 0.01, ***P value between 0.0001 and 0.001, ****P value <0.0001, two-tailed unpaired t test. Results are representative of three independent experiments in A or two independent experiments in B.
Figure S2.
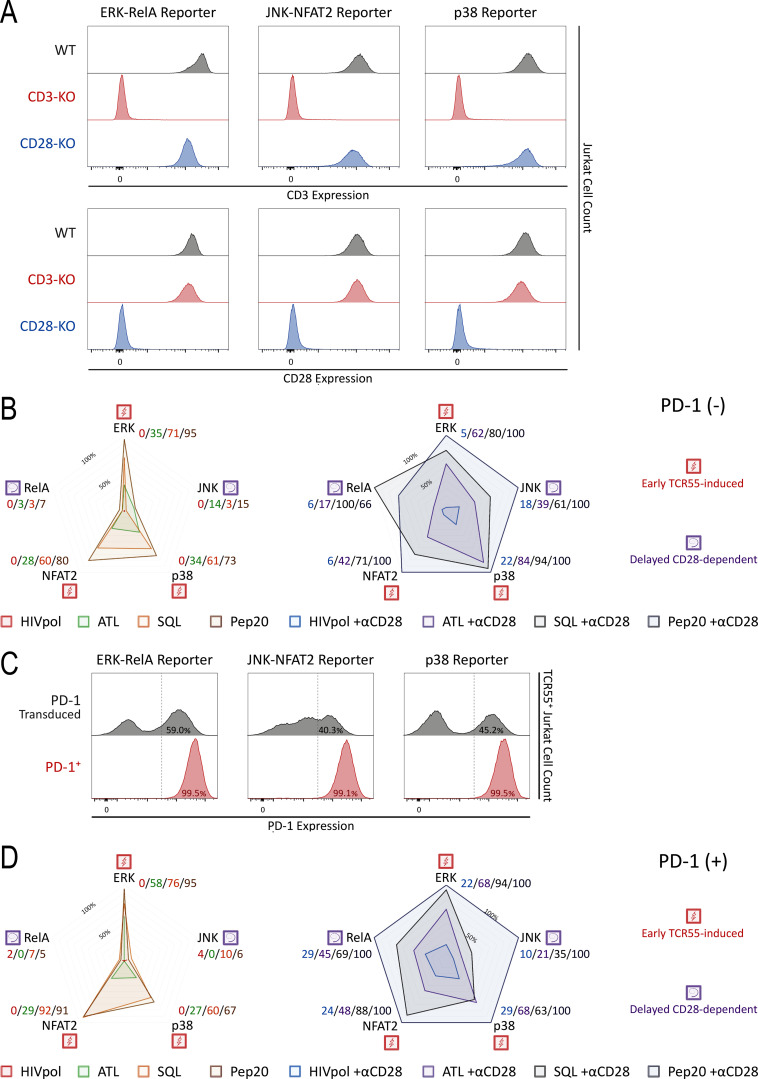
CD3, CD28, and PD-1 expression and signaling profiles induced by TCR55 versus TCR55+CD28 receptor engagement. (A) CD3 and CD28 expression profiles following CRISPR/Cas9-mediated KO and MACS-based purification. Reporter Jurkat cell lines (ERK-RelA, JNK-NFAT2, or p38) versus genotypes (wild-type control, CD3E KO, or CD28 KO) are indicated. (B and D) Radar plots represent normalized mean values of corresponding single-cell AUC/AUP distributions in the (B) absence or (D) presence of PD-1 expression as indicated and shown in Fig. 4 cartoons. Results are representative of two independent experiments. (C) Jurkat reporter PD-1 expression profiles following lentiviral transduction of the LE-hPDCD1 vector and MACS-based purification.
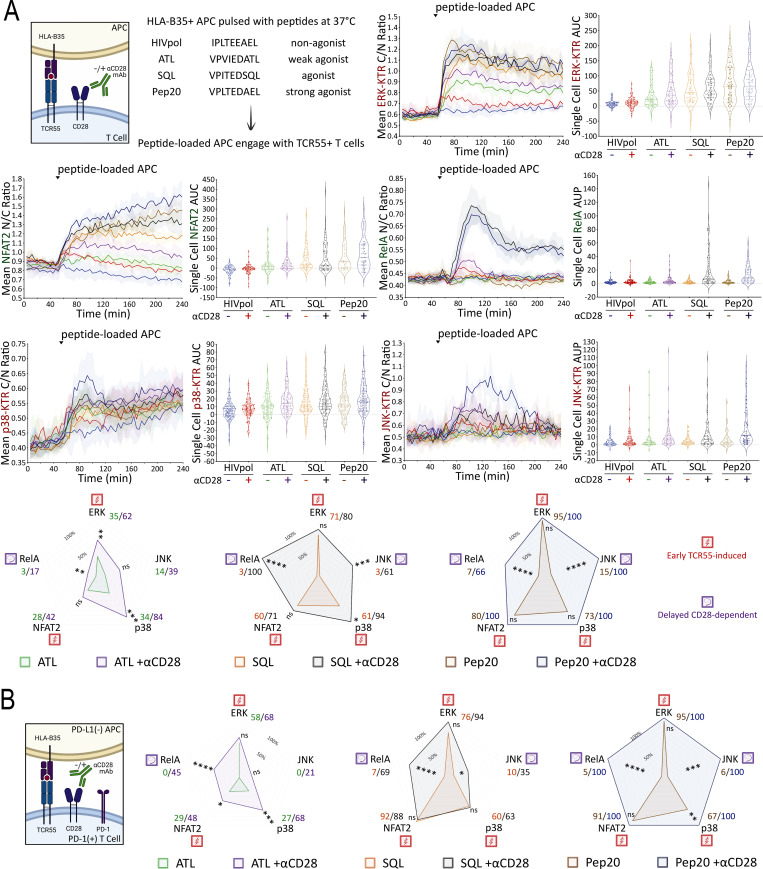
While TCR and CD28 engagement using antibodies is of clinical relevance with respect to the in vitro expansion of T cells for adoptive therapy, it is not the normal physiological mode of stimulation through these receptors. We therefore expressed a human HLA-B35 MHC Class I–restricted TCR (TCR55; Sibener et al., 2018) in the Jurkat FILMSTAR lines and examined MAPK, NFκB, and NFAT signaling profiles upon engagement with Jurkat cells presenting pMHC ligands possessing a range of signaling potencies due to differential activation of catch bonds (multiple strengthened interactions during disengagement) that play a major role in efficacious TCR engagement (Fig. 4 A; see Materials and methods for a discussion of the use of Jurkat as an APC in these experiments). The non-agonist peptide HIVpol, which forms a pMHC ligand that binds to TCR55 but lacks catch bonds, thus leading to a rapid off-rate of ligand binding, failed to activate TCR signaling beyond the background level. In contrast, the strong agonist peptide Pep20, which forms a pMHC ligand with a prolonged bond lifetime due to the acquisition of several catch bonds that slow the off-rate, potently activated signal transduction in the reporter cells. Overall, B35-peptide engagement of TCR55 signaling induced MAPK, NFκB, and NFAT responses that generally correlated with catch bond acquisition rather than solution affinity (Fig. S2 B; Sibener et al., 2018). In accordance with the pathway mapping results employing antibody stimulation (Fig. 3), TCR55 receptor engagement with an agonist pMHC was sufficient to rapidly induce substantial ERK, NFAT2, and p38 signals, while CD28 costimulatory receptor engagement was required in addition to TCR engagement to induce delayed RelA and JNK responses (Fig. 4 A).
Figure 4.
Mapping of TCR55- versus TCR55-CD28–induced signaling in the absence or presence of PD-1 expression. (A) TCR55 ligand peptide sequences are shown. Population response curves (mean ± s.d.) versus single-cell AUC/AUP distributions (violin plots with median and quartiles) comparing the indicated peptide ligand variant in the absence or presence of αCD28 antibody following the addition of peptide-loaded APC at the indicated time point. (A and B) Radar plots represent normalized mean values of corresponding single-cell AUC/AUP distributions in the (A) absence or (B) presence of PD-1 expression as indicated. ns: P value ≥0.05, *P value between 0.01 and 0.05, **P value between 0.001 and 0.01, ***P value between 0.0001 and 0.001, ****P value <0.0001, two-tailed unpaired t test. Results are representative of two independent experiments.
Strongly activating pMHCI-TCR ligands override PD-L1:PD-1 inhibitory signaling
Having defined which signaling pathways were evoked by either TCR engagement alone or required both TCR and CD28 inputs, we next turned to investigate the effect of PD-1 ligation on these disparate responses. The literature contains divergent results with respect to which of these two critical receptor pathways is most affected by PD-1 engagement (Yokosuka et al., 2012; Mizuno et al., 2019; Celis-Gutierrez et al., 2019; Kamphorst et al., 2017; Hui et al., 2017). Although the influence of ligand potency and ligand concentration on specific gene activation events has been studied in the context of PD-1–mediated inhibition (Shimizu et al., 2020), analysis of PD-1 effects on the multiple signaling pathways leading to such gene regulation remains incomplete. To enable such an analysis, we created Jurkat FILMSTAR cell lines that expressed PD-1 together with TCR55 (Fig. S2 C and Fig. 4 B) and verified that there was no change in the pattern of response to TCR engagement by these cells in the absence of PD-1 ligands (Fig. 4 and Fig. S2 D).
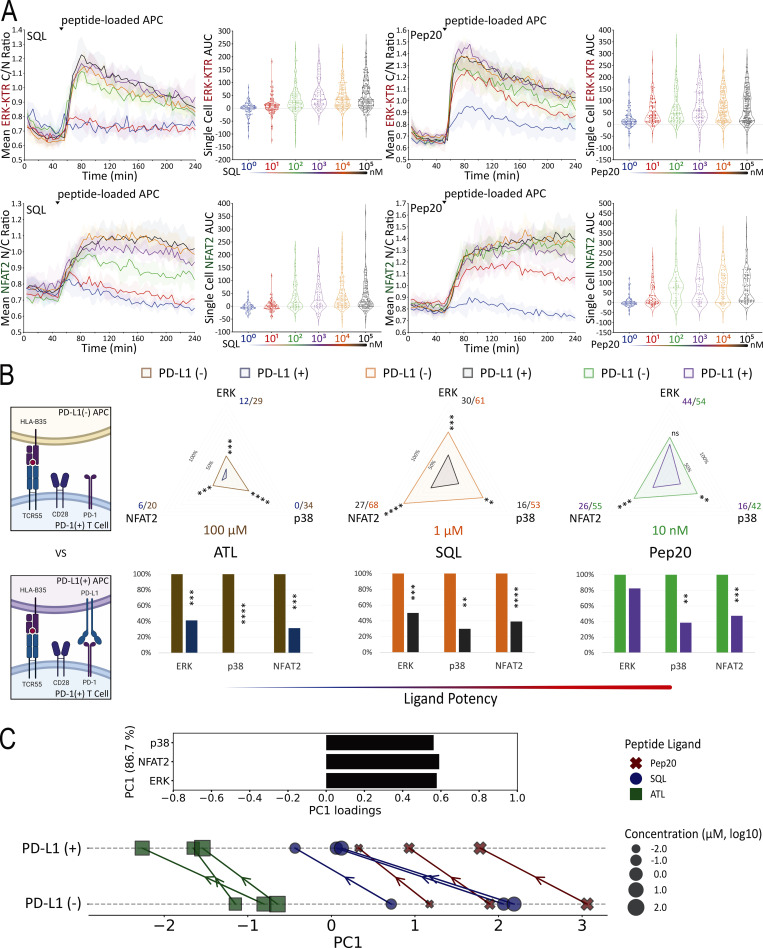
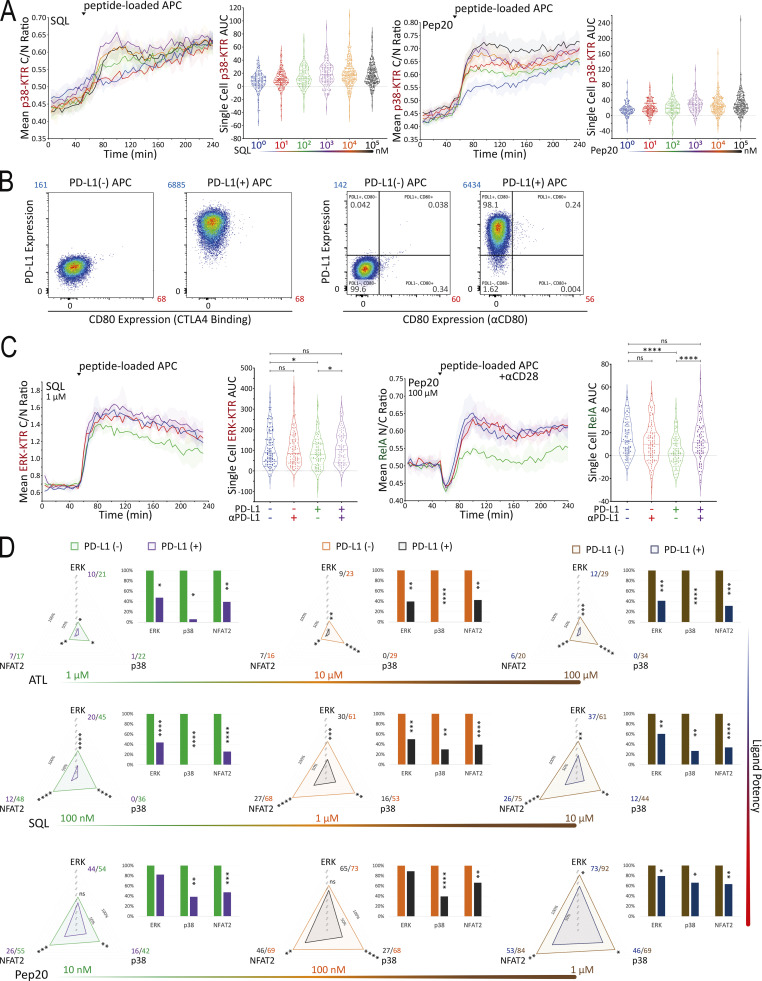
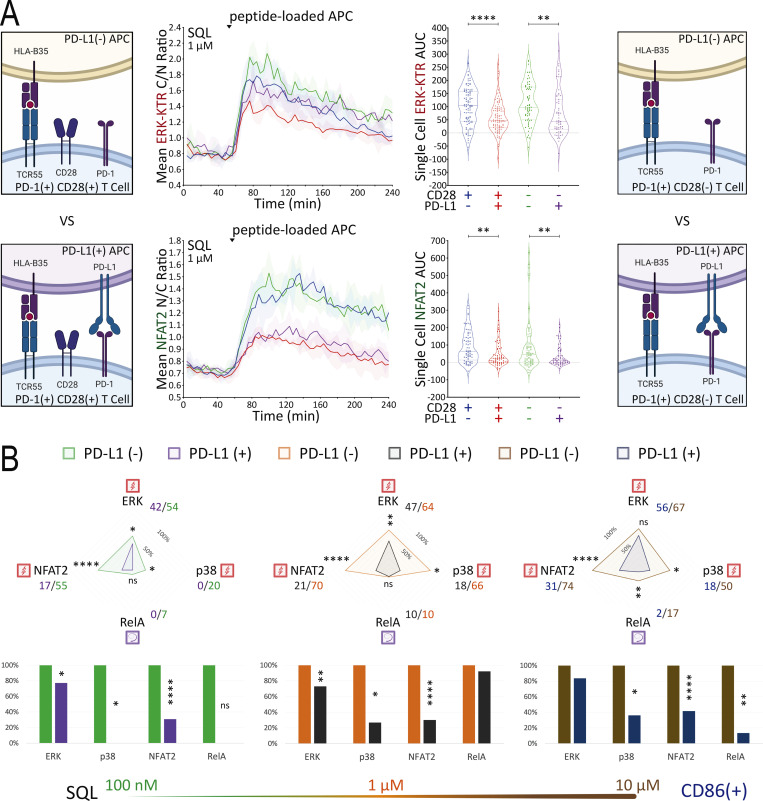
To identify subsaturating and physiologically relevant TCR engagement conditions, we first carried out a series of peptide titration experiments (Fig. 5 A and Fig. S3 A). Next, we created B35+ APC that express PD-L1 (Fig. S3 B) to investigate the inhibitory effects of PD-L1:PD-1 engagement during B35-peptide–dependent TCR55 signaling. Using PD-L1− or PD-L1+ presenting cells pulsed with subsaturating concentrations of ATL (weak agonist), SQL (moderate agonist), or Pep20 (strong agonist) peptides to engage with PD-1+ TCR55-expressing Jurkat reporter cells, we collected ERK, NFAT2, and p38 pathway activation profiles in the absence or presence of PD-L1:PD-1 engagement (Fig. 5 B). To test for whether any inhibition seen when coculturing PD-1+ TCR55+ Jurkat reporter cells with PD-L1+ presenting cells arose from interactions of this specific molecular pair, we used αPD-L1 antibody to block PD-L1:PD-1 interactions (Fig. S3 C). This checkpoint blockade treatment potently reversed PD-1 suppression of TCR55 signaling, indicating that the observed TCR inhibitory effects are specifically induced by PD-L1:PD-1 engagement.
Figure 5.
PD-L1:PD-1 engagement suppresses TCR55 signaling to an extent that negatively correlates with peptide ligand potency. (A) Population response curves (mean ± s.d.) versus single-cell AUC distributions (violin plots with median and quartiles) comparing the indicated peptide ligand concentration titration following the addition of peptide-loaded APC at the indicated time point. Results are representative of three independent experiments. (B) Radar plots represent normalized mean values corresponding to single-cell AUC distributions comparing the indicated peptide ligand quality in the absence versus the presence of PD-L1 expression as indicated. Bar graphs show further normalization of these mean values within each comparison pair. Results are representative of two independent experiments. ns: P value ≥ 0.05, **P value between 0.001 and 0.01, ***P value between 0.0001 and 0.001, ****P value <0.0001, two-tailed unpaired t test. (C) PCA of population response dynamics comparing the indicated peptide ligand quality versus quantity, in the absence versus the presence of PD-L1 expression. Top: The loadings of signaling responses on PC1 (+0.58*ERK+0.59*NFAT2+0.56*p38). Bottom: The projection of signaling responses plotted along the first principal component (PC1).
Figure S3.
SQL versus Pep20 titration, PD-L1 expression, αPD-L1 checkpoint blockade, and PD-L1:PD-1 suppressive effects on TCR55 signaling. (A) Population response curves (mean ± s.d.) versus single-cell AUC distributions (violin plots with median and quartiles) comparing the indicated SQL or Pep20 peptide ligand concentration titration following the addition of peptide-loaded APC at the indicated time point. Results are representative of three independent experiments. (B) PD-L1− versus PD-L1+ APC expression profiles following lentiviral transduction and MACS-based purification. Mean fluorescence intensity (MFI) for PD-L1 (blue) or CD80 (red) staining is shown. (C) Population curves and AUC distributions as in A comparing the indicated PD-L1−/+ versus αPD-L1−/+ conditions following the addition of peptide-loaded APC (1 μM SQL or 100 μM Pep20) at the indicated time point. Results are representative of three technical replicates. (D) Radar plots represent normalized mean values of corresponding single-cell AUC distributions comparing the indicated peptide ligand quality, in the absence versus the presence of PD-L1 expression as indicated. Bar graphs show further normalization of these mean values within each comparison pair. Results are representative of two independent experiments. ns: P value ≥0.05, *P value between 0.01 and 0.05, **P value between 0.001 and 0.01, ***P value between 0.0001 and 0.001, ****P value <0.0001, two-tailed unpaired t test.
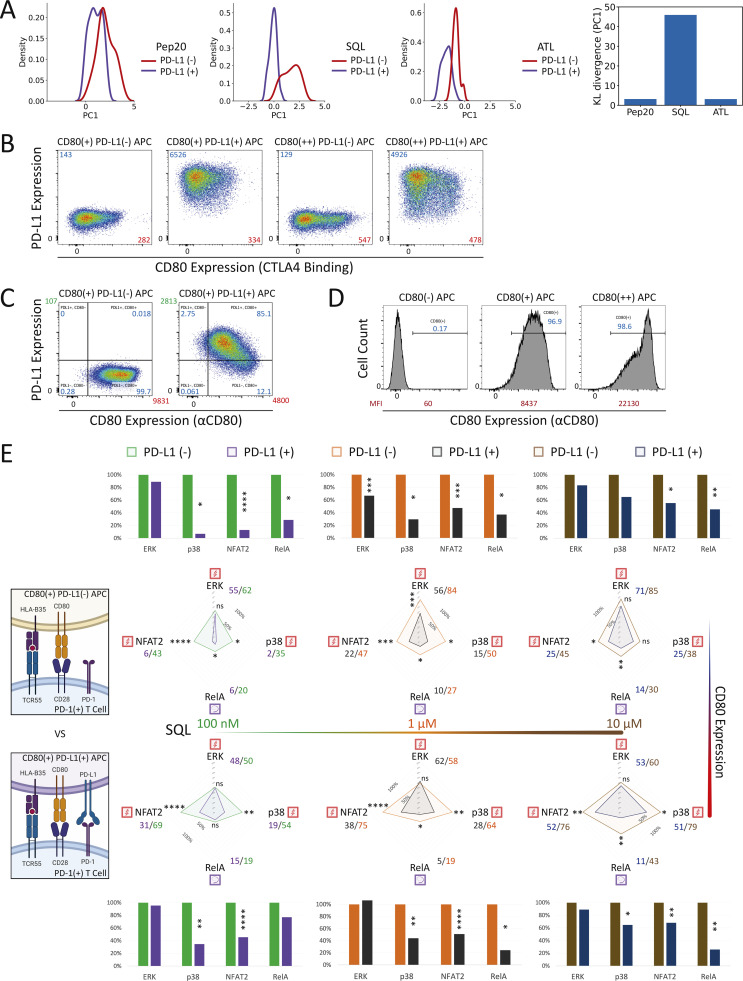
Single-cell AUC data were summarized into radar plots to display differences in TCR55 signaling potency with or without PD-L1:PD-1 inhibitory receptor engagement (Fig. 5 B and Fig. S3 D). The offered peptide concentration clearly affected PD-1 suppressive effects in a dose-response fashion, but the most significant loss of PD-1–mediated inhibition was seen as the strength of B35–peptide–TCR55 interactions increased (Fig. 5 B and Fig. S3 D). This loss of inhibition in connection with increased ligand potency was especially clear with ERK. Recent functional studies of T cell activation using time-resolved high-dimensional machine learning analysis revealed two dominant modes of antigen-driven response (Achar et al., 2022). We applied a similar dimensional reduction method to the population dynamics of T cell signaling response in the Jurkat system. Unsupervised principal component analysis (PCA) of the three-dimensional signaling responses of T cells quantified the impact of PD-1 suppression across different peptide ligand quality and quantity (Fig. 5 C). The first principal component captured the impact of different antigenicity, for TCR signaling alone, independently of the density of pMHC ligands on APC. Adding PD-L1 reduced PC1 consistently across antigens without much impact on other principal components; hence PD-1 activation amounted to a “simple” downgrading of antigen-triggered TCR signals. We then computed the Kullback–Leibler (KL) divergence between the distribution of PC1 for engaging TCR alone versus PC1 for TCR+PD-1 engagement. This revealed that the medium strength peptide ligand SQL correlated with the highest level of PD-L1:PD-1 inhibitory function, indicating a Goldilocks range of TCR signaling strength that is most susceptible to PD-1 suppression (Fig. S4 A). Thus, PD-L1:PD-1 inhibition directly affects signaling pathways activated solely by TCR engagement independently of CD28 input and operates in a manner very sensitive to both intrinsic ligand quality and the density of pMHC ligands on APC.
Figure S4.
PD-L1:PD-1 engagement in the presence of CD80 expression inhibits both TCR55- and TCR55-CD28–dependent pathways. (A) KL divergence comparing the distribution of PC1 between PD-L1− and PD-L1+ conditions. The kernel density plot of the projections of signaling responses along PC1 with or without PD-L1:PD-1 engagement. KL divergence showing the differences in probability distributions between the signaling responses in the absence versus the presence of PD-L1:PD-1 engagement. (B) PD-L1 versus CD80 expression profiles for CD80+ versus CD80++ APC in the absence or presence of PD-L1 expression. MFI for PD-L1 (blue) or CD80 (red) staining is shown. (C) PD-L1 versus CD80 (αCD80 antibody staining) expression profiles for CD80+ APC in the absence or presence of PD-L1 expression. MFI for PD-L1 (green) or CD80 (red) staining is shown. (D) CD80 expression profiles comparing CD80+ versus CD80++ APC in the absence of PD-L1 expression. Percentage of CD80-positive (blue) APC and MFI for CD80 (red) staining are shown. (E) Radar plots represent normalized mean values of corresponding single-cell AUC/AUP distributions comparing the indicated SQL peptide ligand quantity presented by CD80+ (top panel) versus CD80++ (bottom panel) APC in the absence or presence of PD-L1 expression as indicated. Bar graphs show further normalization of these mean values within each comparison pair. ns: P value ≥0.05, *P value between 0.01 and 0.05, **P value between 0.001 and 0.01, ***P value between 0.0001 and 0.001, ****P value <0.0001, two-tailed unpaired t test.
PD-L1:PD-1 engagement primarily targets TCR signaling for inhibition
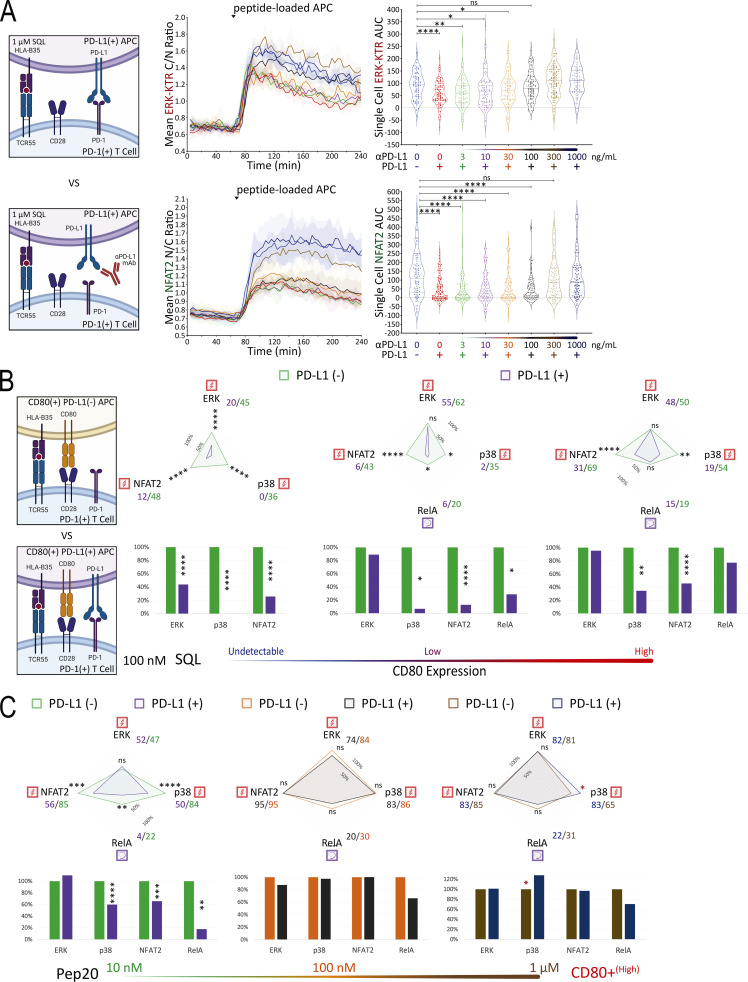
The preceding studies strongly suggested that TCR-induced signals were primary targets of PD-1–mediated inhibition, but to examine this issue further and to directly test the possible targeting of CD28-related signals, we created presenting cells coexpressing PD-L1 and CD80 (Fig. S4 B). Because previous studies suggested that cis-CD80:PD-L1 interaction could interfere with PD-L1:PD-1 inhibitory receptor signaling but not CD80:CD28 costimulatory receptor signaling (Sugiura et al., 2019; Zhao et al., 2019), we first simulated this anticipated cis-blocking interaction using antibody to PD-L1. TCR55+ PD-1+ Jurkat reporter cells were stimulated with PD-L1+ APC loaded with 1 μM SQL peptide along with a titration of αPD-L1 antibodies (Fig. 6 A). TCR55-induced ERK activation was more readily recovered by αPD-L1 antibody blockade as compared with NFAT2 responses. ERK activity was partially restored at 3–30 ng/ml of αPD-L1 antibody, while NFAT2 activity failed to be recovered at <300 ng/ml of αPD-L1 antibody (Fig. 6 A). These data indicate that the ERK pathway requires more PD-L1:PD-1 inhibitory receptor signaling for significant suppression as compared with the NFAT2 pathway. Thus, the suppressive effect of PD-1 on ERK activity is expected to be lost more readily due to cis-CD80:PD-L1 interference as compared with PD-1 inhibition of NFAT2 activity.
Figure 6.
PD-L1:PD-1 engagement in the presence of CD80 expression inhibits both TCR55- and TCR55-CD28–dependent pathways. (A) Population response curves (mean ± s.d.) versus single-cell AUC distributions (violin plots with median and quartiles) comparing the indicated αPD-L1 antibody concentration titration from 0 to 1,000 ng/ml in the presence of PD-L1 expression following the addition of SQL-loaded (1 μM) APC at the indicated time point. Results are representative of two independent experiments. (B) Radar plots represent normalized mean values of corresponding single-cell AUC/AUP distributions comparing the indicated SQL peptide ligand quantity presented by CD80− (left) versus CD80+ (middle) versus CD80++ (right) APC in the absence or presence of PD-L1 expression as indicated. Results are representative of two independent experiments. (C) High CD80 expression and strong TCR signaling abolish PD-L1:PD-1 suppression. Radar plots represent normalized mean values of corresponding single-cell AUC/AUP distributions comparing the indicated Pep20 peptide ligand quantity presented by CD80++ APC in the absence or presence of PD-L1 expression as indicated. Results are representative of three technical replicates. Bar graphs show further normalization of these mean values within each comparison pair. ns: P value ≥0.05, *P value between 0.01 and 0.05, **P value between 0.001 and 0.01, ***P value between 0.0001 and 0.001, ****P value <0.0001, two-tailed unpaired t test.
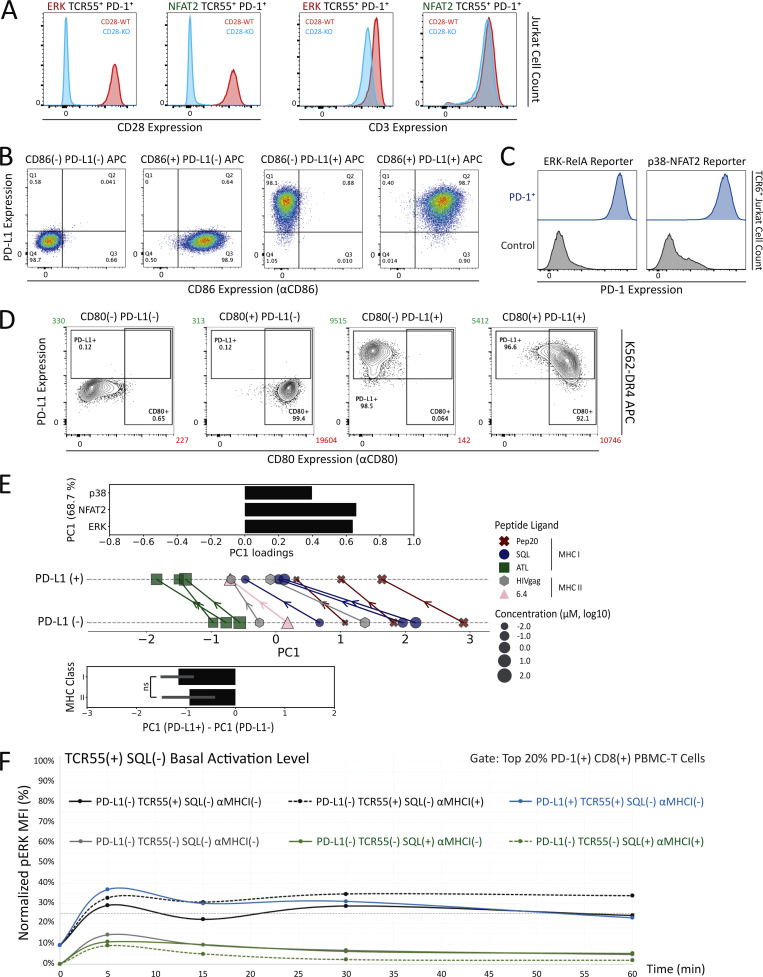
We then characterized a panel of CD80-expressing APC with or without PD-L1 expression (Fig. S4, B–D). Coexpression of CD80 and PD-L1 did not block recombinant CTLA4-Ig binding to CD80 but it did partially block αCD80 or αPD-L1 antibody binding (Fig. S4 B versus Fig. S4 C), presumably due to the presence of cis-CD80:PD-L1 interactions. Using CD80+ PD-L1− or CD80+ PD-L1+ APC loaded with 0.1–10 μM of SQL peptide, TCR55+ PD-1+ reporter Jurkat T cells were engaged, while ERK, RelA, NFAT2, and p38 pathway activation profiles were collected in the absence or presence of PD-L1:PD-1 inhibitory receptor engagement (Fig. 6 B, middle; and Fig. S4 E, top). We repeated these experiments using CD80++ PD-L1− or CD80++ PD-L1+ APC to evaluate the impact of higher CD80 expression and thus stronger cis-CD80:PD-L1 interference on PD-L1:PD-1 suppressive effects (Fig. 6 B, right; and Fig. S4 E, bottom). In the presence of high CD80 expression, there was a clear reduction in PD-1 inhibitory function, especially involving the ERK signaling pathway (Fig. 6 B and Fig. S3 D versus Fig. S4 E). This reduction is likely due to cis-CD80:PD-L1 interference that partially disrupts PD-L1:PD-1 engagement to an extent similar to treatment with 100 ng/ml of αPD-L1 antibody (Fig. 6 A). In the presence of both high CD80 expression and strong B35-Pep20-TCR55 signaling, PD-L1:PD-1 suppressive effects were almost completely eliminated (Fig. 6 C). The majority of these experiments did not show a biased effect of PD-L1:PD-1 suppression on the TCR55+CD28-dependent RelA pathway (Fig. 6 B and Fig. S4 E), again suggesting that TCR-derived signals are the primary targets of PD-1 inhibitory signaling. To investigate whether CD28 receptor expression is required for effective PD-1 inhibitory signaling, we created CD28-KO TCR55+ PD-1+ reporter Jurkat T cell lines (Fig. S5 A) using CRISPR/Cas9. These experiments showed that as expected from the preceding results, CD28 costimulatory receptor expression is not required for PD-1 inhibitory effects on either the TCR55-induced ERK or NFAT2 signaling pathway (Fig. 7 A).
Figure S5.
CD3, CD28, CD86, PD-1, CD80, and PD-L1 expression profiles and background ERK activation level. (A) CD3 and CD28 expression profiles following CRISPR/Cas9-mediated KO of CD28 and MACS-based purification. TCR55+ PD-1+ ERK-KTR-mScarlet or GFP-NFAT2 reporter Jurkat line is indicated. (B) PD-L1 versus CD86 expression profiles for CD86+ APC in the absence or presence of PD-L1 expression. (C) Jurkat reporter PD-1 expression profiles following lentiviral transduction of the LE-hPDCD1 vector and MACS-based purification. (D) PD-L1−, CD80+, PD-L1+, and CD80+ PD-L1+ APC expression profiles following lentiviral transduction and MACS-based purification. (E) PCA quantification of the impact of PD-L1:PD-1 engagement considering both MHCI and MHCII peptide ligands at various concentrations. Top: The loadings of signaling responses on PC1 (+0.64*ERK+0.66*NFAT2+0.40*p38). Middle: PCA of population response dynamics comparing the indicated peptide ligand quality versus quantity, in the absence versus the presence of PD-L1:PD-1 engagement, plotted along PC1. Bottom: PC1 variations between PD-L1− and PD-L1+ conditions. ns: P value ≥0.05, Student’s t test. (F) The baseline is shown for antigen-specific pERK response in the absence of TCR55 expression or peptide ligand SQL. FACS gating strategy for human PBMC-derived PD-1+ CD8+ T cells is shown in Fig. 10 B. Population pERK response curves are shown for the top 20% PD-1+ CD8+ T cells comparing TCR55−/+ versus SQL−/+ versus MHCI-blocking antibody clone W6/32−/+ versus PD-L1−/+ control APC conditions. Dashed line indicates pERK background activation level in the presence of both HLA-B35 and TCR55 but in the absence of SQL peptide ligand.
Figure 7.
CD86 expression slightly reduces PD-L1:PD-1 suppressive effects. (A) Population response curves (mean ± s.d.) versus single-cell AUC distributions (violin plots with median and quartiles) comparing wild-type versus CD28-KO reporter responses in the absence or presence of PD-L1 expression following the addition of SQL-loaded (1 μM) APC at the indicated time point. Results are representative of two independent experiments. (B) Radar plots represent normalized mean values of corresponding single-cell AUC/AUP distributions comparing the indicated SQL peptide ligand quantity presented by CD86+ APC in the absence or presence of PD-L1 expression. Bar graphs show further normalization of these mean values within each comparison pair. Results are representative of three technical replicates. ns: P value ≥0.05, *P value between 0.01 and 0.05, **P value between 0.001 and 0.01, ****P value <0.0001, two-tailed unpaired t test.
CD86:CD28 binding affinity is approximately fivefold lower than that of CD80:CD28 (Collins et al., 2002), and CD86 has not been reported to interfere with PD-L1:PD-1 signaling. Engaging TCR55+ PD-1+ reporter Jurkat T cells with CD86+ PD-L1− or CD86+ PD-L1+ APC (Fig. S5 B) showed maintenance of PD-L1:PD-1 inhibition rather than the diminution of such inhibition seen with CD80+PD-L1 coexpression (Fig. 7 B). As expected, CD86:CD28 engagement delivered a weaker TCR costimulatory signal and thus induced less NFκB-RelA activation than CD80:CD28 receptor engagement (Fig. S4 E).
pMHCII-TCR signals are strongly suppressed by PD-L1:PD-1 receptor engagement
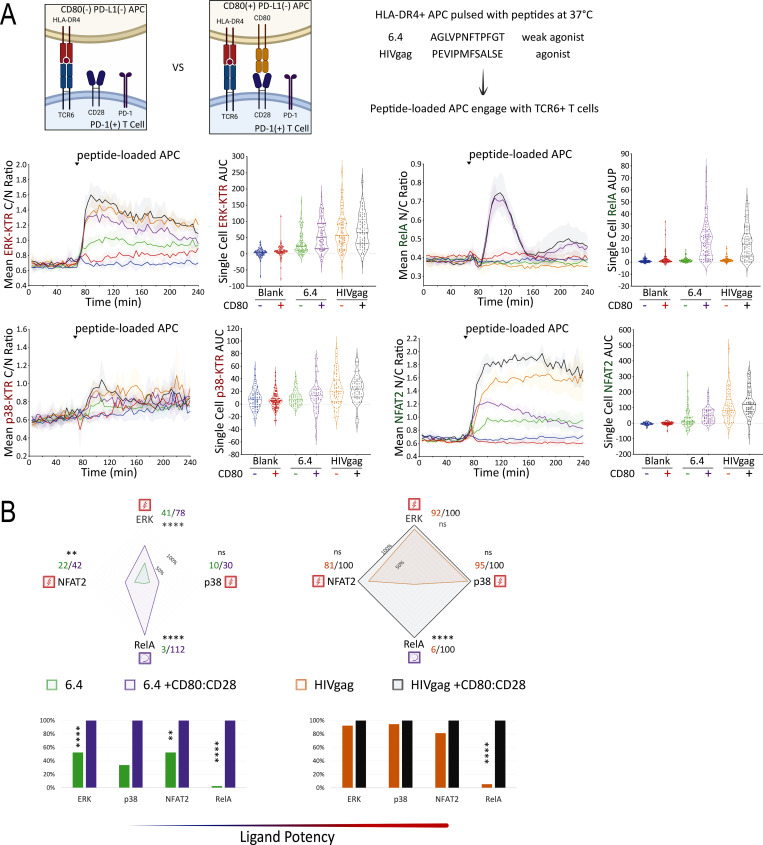
To investigate whether PD-L1:PD-1 engagement also inhibits TCR signals triggered by peptide ligands presented by MHC Class II molecules, we expressed a human HLA-DR4 restricted TCR (TCR6; Sibener et al., 2018) in the Jurkat FILMSTAR lines (Fig. S5 C). We collected ERK, NFAT, NFκB, and p38 activation profiles following TCR stimulation by pMHCII ligands possessing weak versus medium signaling potencies (Fig. 8 A). In the absence or presence of CD80 expression (Fig. S5 D), the self-peptide control (blank) did not induce TCR signaling above the background level (Fig. 8 A). In contrast, both the weak agonist peptide 6.4 and agonist peptide HIVgag triggered TCR6 signal transduction activities substantially above the background (Fig. 8 A). Consistent with the TCR55 pathway mapping results (Fig. 4 B), TCR6 receptor engagement with an agonist pMHC was sufficient to induce substantial ERK, NFAT2, and p38 signal transduction activities, while both TCR and CD28 costimulatory receptor engagements were strictly required to induce the NFκB-RelA nuclear translocation (Fig. 8 B).
Figure 8.
Mapping of TCR6- versus TCR6-CD28–induced signaling in the presence of PD-1. (A) TCR6 ligand peptide sequences are shown. Population response curves (mean ± s.d.) versus single-cell AUC/AUP distributions (violin plots with median and quartiles) comparing the indicated peptide ligand variant in the absence or presence of CD80 following the addition of peptide-loaded APC at the indicated time point. Blank indicates the addition of APC without peptide pulsing. (B) Radar plots represent normalized mean values of corresponding single-cell AUC/AUP distributions in the absence or presence of CD80:CD28 signaling as indicated. Bar graphs show further normalization of these mean values within each comparison pair. ns: P value ≥0.05, **P value between 0.001 and 0.01, ****P value <0.0001, two-tailed unpaired t test. Results are representative of two independent experiments.
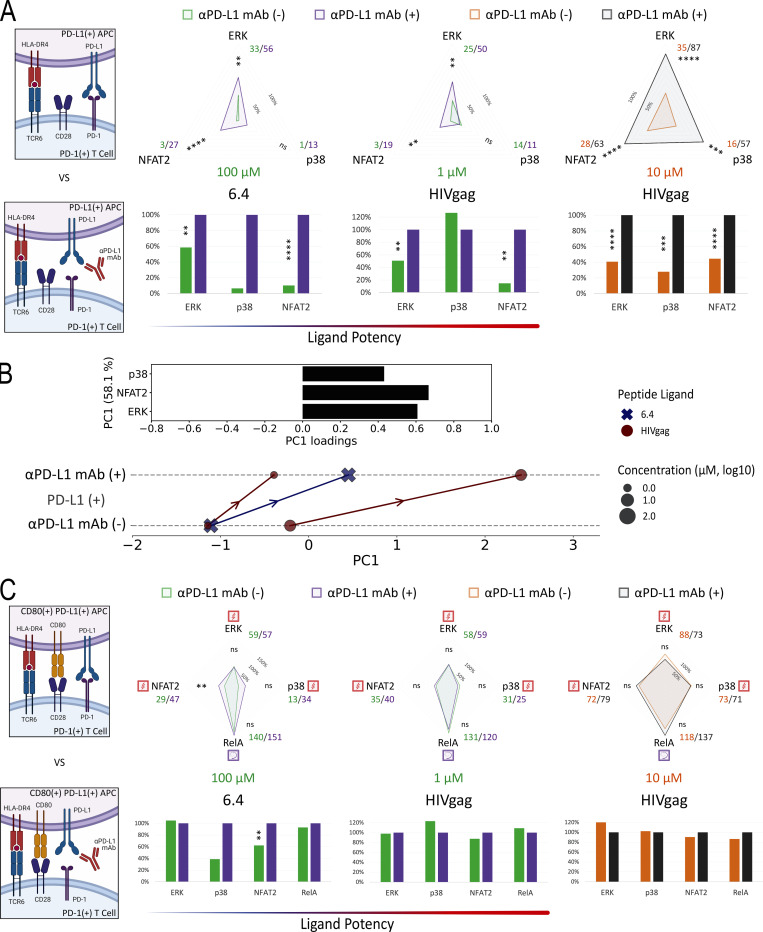
We then created DR4+ APC that expresses PD-L1 (Fig. S5 D) to investigate the inhibitory effects of PD-L1:PD-1 engagement during DR4-peptide–dependent TCR6 signaling. Using CD80− PD-L1+ APC pulsed with subsaturating concentrations of 6.4 (weak agonist) or HIVgag (moderate agonist) peptides to engage with PD-1+ TCR6-expressing Jurkat reporter cells in the presence or absence of αPD-L1 antibody, we collected ERK, NFAT2, and p38 pathway activation profiles (Fig. 9 A). Single-cell AUC data were summarized into radar plots to display differences in TCR6 signaling potency with or without PD-L1:PD-1 inhibitory receptor engagement (Fig. 9 A). Population dynamics data were summarized by PCA to illustrate the variations in PD-1 suppression among the peptide ligand quality and quantity (Fig. 9 B). Blocking PD-L1 increased PC1, the dominant mode of antigen-driven signaling, consistently across antigens (Fig. 9 B). Combined PCA using dynamics data from both B35-TCR55 (MHC Class I) and DR4-TCR6 (MHC Class II) showed similar PD-L1:PD-1 suppressive effects on both types of pMHC-TCR signaling (Fig. S5 E).
Figure 9.
PD-L1:PD-1 engagement inhibits TCR6 signaling efficiently in the absence but not in the presence of CD80 expression. (A) Radar plots represent normalized mean values of corresponding single-cell AUC distributions in the absence or presence of PD-L1 blocking antibody as indicated. Bar graphs show further normalization of these mean values within each comparison pair. (B) PCA of population response dynamics comparing the indicated peptide ligand quality versus quantity, in the absence versus the presence of PD-L1 blocking antibody. Top: The loadings of signaling responses on PC1 (+0.61*ERK+0.67*NFAT2+0.43*p38). Bottom: The projection of signaling responses plotted along the PC1. (C) Radar plots represent normalized mean values of corresponding single-cell AUC/AUP distributions in the absence or presence of PD-L1 blocking antibody. Bar graphs show further normalization of these mean values within each comparison pair. ns: P value ≥0.05, **P value between 0.001 and 0.01, ***P value between 0.0001 and 0.001, ****P value <0.0001, two-tailed unpaired t test. Results are representative of two independent experiments.
Using CD80+ PD-L1+ APC (Fig. S5 D) pulsed with 6.4 or HIVgag peptide, TCR6+ PD-1+ reporter Jurkat T cells were engaged while ERK, NFκB-RelA, NFAT2, and p38 pathway activation dynamics were recorded in the absence or presence of αPD-L1 antibody (Fig. 9 C). In the presence of CD80 expression, there was a dramatic reduction in PD-1 inhibitory function for all TCR signaling pathways regardless of CD28 dependency (Fig. 9 C). This reduction is most likely explained by the high level of cis-CD80:PD-L1 interference that almost completely abolished PD-L1:PD-1 engagement. These experiments did not show a biased PD-1 suppressive effect on the TCR6+CD28–dependent RelA pathway (Fig. 9 C), further supporting that PD-1 primarily targets TCR-derived signals for suppression.
PD-1 signaling efficiently suppresses TCR-induced ERK activation in human primary CD8+ T lymphocytes
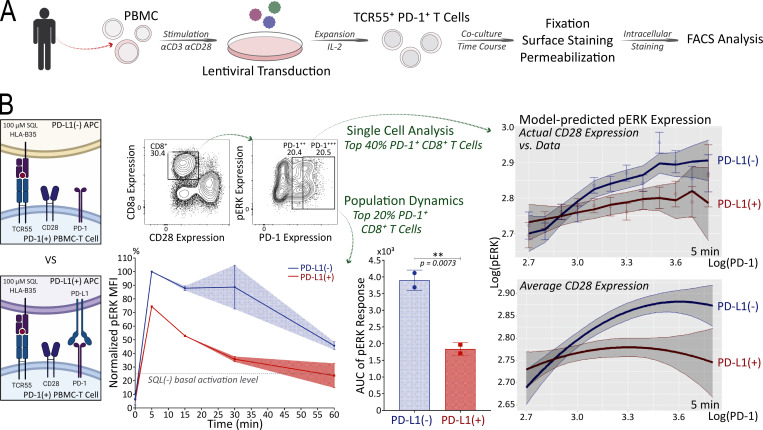
As valuable as the Jurkat FILMSTAR system described here was for these detailed studies of TCR and CD28 signaling in the context of PD-1 engagement, it was important to test the key result of these Jurkat studies using primary T lymphocytes because of known biochemical abnormalities in the leukemia cells, such as loss of PTEN expression (Abraham and Weiss, 2004). To this end, human PBMCs were transduced with lentiviral vectors to create a mixed T cell population containing a fraction of activated TCR55+ PD-1+ primary T cells (Fig. 10 A). Using PD-L1− or PD-L1+ presenting cells pulsed with 100 μM of SQL peptide ligand, these populations containing a subpopulation of TCR55+ PD-1+ human PBMC-derived T cells were engaged for 5, 15, 30, or 60 min before fixation, followed by cell surface marker and intracellular phosphorylated ERK (pERK) staining (Fig. 10 B). As a way of concentrating our measurements on the subset of T cells with TCR55 expression (which could not be assessed directly), we focused on the top 20% of the PD-1+ CD8+ human primary T cells since PD-1 expression is linked to the strength of TCR signaling. In the presence of PD-L1:PD-1 engagement, analysis of the selected subpopulation showed a significant reduction in TCR55-induced ERK activation (Fig. 10 B and Fig. S5 F), consistent with the Jurkat ERK-KTR data (Fig. 5 B). Fitting a regression model to single-cell data from the top 40% of PD-1+ CD8+ human primary T cells confirmed that for a wide range of PD-1 expression, PD-L1:PD-1 engagement significantly reduced ERK activation. This was true regardless of whether model predictions were generated using single-cell CD28 expression or the population average CD28 expression (Fig. 10 B), suggesting that CD28 is dispensable for PD-1–mediated inhibition of ERK activation, in agreement with the Jurkat system (Fig. 7 A). Overall, these human primary T cell data clearly showed that PD-L1:PD-1 engagement could efficiently target TCR signaling for inhibition.
Figure 10.
PD-L1:PD-1 engagement suppresses TCR55-induced ERK activation efficiently in human primary CD8+ T cells. (A) Workflow of engineering TCR55+ PD-1+ human primary PBMC-derived T cells for coculture time course experiments and the subsequent intracellular staining analysis. (B) FACS gating strategy for PD-1+ CD8+ T cells (top left). Population pERK response curves and AUC (mean ± s.d.; bottom left) for top 20% PD-1+ CD8+ T cells comparing PD-L1− versus PD-L1+ SQL-loaded (100 μM) APC condition. Dashed line indicates pERK background activation level in the absence of SQL peptide ligand (Fig. S5 F). **P value between 0.001 and 0.01, one-tailed unpaired t test. Single-cell analysis with multivariable model predictions (right panels) for top 40% PD-1+ CD8+ T cells. Model-predicted pERK expression over a discrete range of PD-1 expression (top right), accounting for the true distribution of CD28 expression in the data at each PD-1 expression value. Data points indicate mean values from the data, and error bars indicate standard error around those means. Model-predicted pERK expression over a continuous range of PD-1 expression values (bottom right), assuming that CD28 expression is fixed at its overall mean. Solid lines indicate model predictions and shaded intervals represent the 95% credible intervals around those predictions. Results are representative of two independent experiments with human PBMC from the same donor.
Discussion
The specific biochemical events that follow the ligation of PD-1 on antigen-stimulated T cells remain unclear, as does the relationship between the quality of TCR engagement and PD-1 inhibitory capacity. Gaining insight into these issues is extremely complex as it requires measuring and deconvoluting many simultaneous molecular events involving interacting cell populations in a time-resolved, quantitative manner. Several studies have provided evidence for PD-1–associated phosphatases acting on proximal TCR tyrosine phosphorylation events whereas others have emphasized dominant action on enzymatic activities putatively linked to CD28 signaling. Functional assays involving cytokine or chemokine production have been used to assess PD-1 function in the context of the strength of TCR input signals, but these failed to clearly distinguish between pMHC versus costimulatory ligand actions.
In this study, we have explored these issues using a new multiplex, dynamic, live single-cell analytical method (FILMSTAR) that is focused on the transcription factor intermediates (or their inducing enzymes) downstream of the receptor proximal kinases involved in antigen-dependent T cell signaling and upstream of gene transcriptional activities. Furthermore, we have employed two TCR models in which signaling strength is dependent on the acquisition of catch bonds with ligands of roughly similar TCR/pMHC solution affinities. Using these new tools, we have identified which responses are solely TCR-induced and independent of CD28 input from those requiring conjoint signaling. None of the examined mediators was induced by CD28 signaling alone. By employing well-studied TCRs with atomic level information about binding to various pMHC ligands that vary substantially in functional potency, we could simultaneously assess whether PD-1 inhibition preferentially affects TCR- or CD28-dependent events and also how TCR engagement on a qualitative and quantitative level influences the action of this inhibitory pathway. Our findings clearly establish that PD-1 directly affects signals from the TCR that are independent of any costimulatory (CD28) input and, further, that the extent of depression of these TCR-linked signaling events is affected in a nonlinear manner by both ligand quality and quantity.
These results are fully congruent with very early studies (Yokosuka et al., 2012; Sheppard et al., 2004; Fife et al., 2009; Latchman et al., 2001) of PD-1 that showed inhibition of the most proximal steps of TCR signaling through recruitment of the phosphatase SHP-2. They also agree with several subsequent studies (Mizuno et al., 2019; Celis-Gutierrez et al., 2019) showing PD-1 inhibition of TCR-induced phosphorylation events or cytokine production, and also recent data (Shimizu et al., 2021, 2020) suggesting a link between the strength of TCR engagement and the extent of PD-1 inhibition. They amplify this earlier work by providing new results at a downstream level from the early kinase events, namely with respect to activated transcription factors that play a proximate role in gene activation. These observations also reveal that as one varies TCR ligand potency and quantity, the effects of PD-1 inhibition are asymmetric, differentially influencing NFAT and p38 while sparing ERK at high concentrations of potent agonist ligands. These latter results strongly suggest that both the heterogeneity of TCRs among tumor-specific T cells subject to checkpoint blockade therapy with anti-PD-1 or anti-PD-L1, together with the variable relationship of tumor pMHC neoantigens to these many TCRs with respect to agonist strength, will result in diverse effects on signaling and gene activation during treatment. How such differences play out and whether they contribute to the variability of response seen in distinct patients is unknown, but worthy of additional study.
In accordance with the two-signal model, our data in this study showed that TCR-dependent signaling pathways could be classified into two major categories: early TCR/CD3-induced ERK, NFAT2, and p38 signaling (Signal 1) versus delayed TCR+CD28-dependent RelA and JNK signaling (Signal 1+2). This observation is clear in the cases of medium/strong TCR55 agonist peptides SQL/Pep20 and TCR6 agonist peptide HIVgag, while it becomes slightly less clear in the cases of weak TCR55 ligand ATL and weak TCR6 ligand 6.4. Data obtained from CD3-KO conditions suggest that engagement of the costimulatory receptor CD28 alone (Signal 2) is insufficient to activate downstream signaling to the ERK, NFAT2, or p38 pathways, a conclusion that is strengthened by the data obtained from CD80:CD28 engagement in the absence of agonistic DR4-TCR6 peptide ligand. The requirement of CD28 input for TCR-induced RelA and JNK activation in Jurkat T cells featuring constitutively active PI3K-AKT pathway indicates the possibility of an additional signaling pathway downstream of CD28 receptor engagement that is essential for the transduction of Signal 2. A potential candidate of this additional pathway involves the CARD11-BCL10-MALT1-TAK1 signalosome, which is clearly shown in Fig. 2 B to be required for CD3/CD28-induced RelA and JNK (Blonska et al., 2007; Yang et al., 2016; Chan et al., 2013) but not ERK and NFAT2 activations.
The NFκB-RelA response to conjoint stimulation via both TCR and CD28 receptors did not show greater sensitivity to PD-1-mediated inhibition than the pure TCR-evoked NFAT2 and p38 responses. This argues against inhibition of CD28 inputs being quantitatively more sensitive than inhibition of TCR-only signaling. This conclusion differs from that of a previous study (Hui et al., 2017), conducted primarily with synthetic responding cells and using PI3K as a representative for the CD28 pathway in Jurkat T cells. Because of PTEN deficiency (Abraham and Weiss, 2004), Jurkat cannot be used for analysis of PI3K signaling reporters, so it remains unclear if pathways beyond those studied here and linked solely to CD28 are of greater sensitivity to PD-1 suppression than some of the TCR-linked or dual receptor–induced events we probed in our work. The canonical picture of CD28 signaling involves not only PI3K but also Grb2 leading to an ERK response (Riha and Rudd, 2010); however, we found no evidence of ERK activation upon CD28 crosslinking in cells lacking CD3 expression or during CD80:CD28 engagement, raising questions of whether “bystander” TCR engagement in microdomains during prior studies accounted for such ERK activity.
In both mouse and human T cells, previous reports (Sugiura et al., 2019; Zhao et al., 2019) had clearly shown that cis-CD80:PD-L1 interaction could interfere selectively with PD-L1:PD-1 but not CD80:CD28 engagement. We were able to confirm the previously reported depression of PD-1-mediated inhibition by cis-interaction of PD-L1 with CD80 on the APC. Critically, this interaction preserves the capacity of CD28 to interact with the CD80 protein at the same time as the cis-association blocks PD-L1:PD-1 binding. Given our findings of a direct effect of PD-1 on TCR-evoked signals, CD80 expression thus has a dual effect on T cell activation. By limiting PD-1–mediated inhibition of the TCR-dependent signals generated by pMHC recognition while also promoting coincident CD28 signaling, the T cells receive an enhanced set of inputs—more effective TCR signaling in concert with greater CD28 costimulation. Given the key role of NFκB in many functions of T cells and the data here that activation of the NFκB pathway requires conjoint TCR and CD28 signaling, it is apparent that upregulation of CD80 on an APC will potently promote T cell activation and effector function. This is quite distinct from CD86, which not only has a lower affinity for CD28 and thus, is less potent intrinsically, but it also fails to inhibit PD-1:PD-L1 interactions and hence lacks the dual amplifying effect just described.
Our data suggest that cis-CD80:PD-L1 interference functions in a way similar to partial αPD-L1 checkpoint blockade and preferentially enhances TCR-induced ERK as compared with the CD28-dependent RelA signaling pathway. Without considering the cis-CD80:PD-L1 interference and data from the NFAT2 and p38 reporters, these observations could mislead us to conclude that PD-1 primarily targets CD28 receptor signaling. As compared with the NFAT2 or p38 signaling, the ERK pathway activity could be significantly restored from PD-L1:PD-1–induced suppression by elevated TCR input signal such as with strong TCR55 agonist Pep20. These results suggest that TCR-induced ERK activation belongs to low-threshold signaling events that become saturated earlier than other TCR-induced signaling events such as NFAT2 and p38 activations, in accord with earlier studies showing a near “digital” response of the ERK pathway to TCR engagement (Altan-Bonnet and Germain, 2005; Das et al., 2009). With the combination of elevated TCR input signal and strong cis-CD80:PD-L1 interference, PD-L1:PD-1 suppressive effects could be diminished or significantly reversed in the case of p38 activation by high concentrations of Pep20. These results together imply that PD-L1:PD-1 inhibitory receptor engagement primarily targets TCR instead of CD28 receptor for suppression. Our data and conclusions however do not argue against the requirement of CD28 expression for the effective proliferation of tumor-specific T cells following checkpoint blockade treatment (Kamphorst et al., 2017). The evidence here shows a joint requirement for TCR and CD28 signaling to elicit key intracellular responses such as NFκB that contribute to CD28-dependent T cell survival and proliferation, which would explain how inhibition of the negative PD-1 axis contributes to antitumor responses.
This study reveals how TCR ligand quality and quantity impact PD-1 suppressive effects and how TCR downstream signaling pathways are differentially regulated by PD-1 inhibition. MAPK signaling and nuclear factor translocation profiles closely relate to transcriptional activation of a diverse combination of genetic programs wired for effective immune responses against various levels of TCR stimuli and extracellular conditions. We made use here of TCRs studied in structural detail and shown to make a different set of catch bonds with altered peptides associated with the appropriate MHC molecule. The extent of catch bond formation tracks the potency of these pMHC ligands, and the differences in off-rate imposed by the differential binding patterns not only affect the overall functional potency of these ligands but also the balance among different transcription factor activities in T cells. Such differences can explain prior reports (Hemmer et al., 1998) of the existence not just of weak and strong agonists for the TCR but of partial agonists showing nonlinear changes in the dose responses for different functional read-outs. This is presumably because the requirements for these different transcription factors vary among target genes or cell differentiation states and hence, alterations in the ratios of these activated factors will give different extents of transcription activity. These latter considerations may be of importance in understanding the diversity of T cell functions seen in response to a mix of neoantigens, each of which can lie in a different part of the partial agonist to strong agonist scale for those TCRs with which it interacts.
Finally, the new FILMSTAR methodology introduced here provides a robust platform for multiplex testing of T cell signaling events in response to diverse inputs, with more quantitative data output than can be obtained from bulk analyses using blotting. The single-cell imaging approach allows dose-response outcomes to be parsed into whether one is seeing more or fewer responding cells or a greater or lesser response per cell. While flow cytometry can provide similar single-cell information, it does not permit the kinetic analysis of individual cell responses as does the live translocation imaging employed here. The ease of manipulating Jurkat using CRISPR, as already reported (Chi et al., 2016; Chan et al., 2021), provides a convenient path to dissecting signaling pathways or the influence of metabolic alterations on the signaling response, with read-out at multiple levels simultaneously. This technology was effective in helping to provide more insight into how a key inhibitory pathway (PD-1:PD-L1) operates to regulate T cell signaling and in elucidating more clearly what connections between primary signaling events and gene transcription are controlled by the TCR versus CD28. These new findings have direct relevance for our basic understanding of T cell activation as well as the biological effects that may occur in response to checkpoint inhibitor therapy. The live cell reporter translocation system and image data processing pipeline we developed in this study can be readily applied to answer questions related to other checkpoint receptors, costimulatory receptors, cytokine receptors, and various types of chimeric antigen receptors.
Materials and methods
Human samples and cell lines
Human normal primary peripheral blood mononuclear cells (PBMC) isolated from healthy anonymous donors were purchased from ATCC (PCS-800-011). This was exempted from the need for informed consent and Institutional Review Board review, as determined by the National Institutes of Health (NIH) Office of Human Subjects Research Protection. HEK293T (CRL-3216) and Jurkat (clone E6-1, TIB-152) cell lines were purchased from ATCC. The K562-DR4 cell line was a gift from Mark Davis’s lab (Stanford University School of Medicine, Stanford, CA, USA). Cell lines were kept in a humidified incubator at 37°C with 5% CO2. Jurkat cell lines, K562-DR4 cell line, and human PBMC were cultured in RPMI 1640 supplemented with 10% FBS, 2 mM L-glutamine, 50 U/ml penicillin, 50 µg/ml streptomycin, and 50 µM β-mercaptoethanol. The HEK293T cell line was cultured in DMEM supplemented with 10% FBS, 2 mM L-glutamine, and 18 mM HEPES.
Molecular cloning of lentiviral expression plasmids
LCAG-HBG, LEG11-RelA, and LEG11-NFAT2 lentiviral expression plasmids were created by Gibson Assembly cloning based on a split-GFP system described previously (Cabantous et al., 2005, 2013). RelA or NFAT2 was PCR amplified from the pCMV4-p65 (#21966; Addgene; Ballard et al., 1992) or the EGFPC1-huNFATc1EE-WT (#24219; Addgene; Beals et al., 1997) plasmid. EF1α-ERK-KTR-mScarlet (LE-EKS), EF1α-JNK-KTR-mScarlet (LE-JKS), and EF1α-p38-KTR-mScarlet (LE-38KS) lentiviral expression vectors were generated by Gibson Assembly cloning based on the ERK-KTR-Clover, a JNK-KTR-mRuby2 and p38-KTR-mCerulean3 plasmids from the Markus Covert lab (#59150, #59154 or #59155; Addgene; Regot et al., 2014). TCR55α, TCR55β, TCR6α, and TCR6β chains were cloned individually into lentiviral pHR vectors based on previously reported constructs (Sibener et al., 2018). EF1α-human-PDCD1 (LE-hPDCD1) and EF1α-human-PD-L1 (LE-hPDL1) lentiviral expression vectors were constructed by Gibson Assembly cloning based on a human PD-1 cDNA template (HG10377-M; SinoBiological) or a human PD-L1 cDNA template (HG10084-M; SinoBiological). EF1α-human-CD80 (LE-hCD80) and UbC-human-CD86 (LU-hCD86) lentiviral expression vectors were obtained from Applied Biological Materials (#155690610695 and #155750610895 respectively).
CRISPR-Cas9 mediated genome engineering
All gRNA (guide RNA) targeting sequences are shown in 5′ to 3′ direction. RelA gRNA-A (5′-AGAGGCGGAAATGCGCCGCG-3′), gRNA-1 (5′-CTCGTCTGTAGTGCACGCCG-3′), and HDR donor plasmids were delivered and selected using a protocol described previously (Chan et al., 2021). gRNAs targeting BCL10 (4: 5′-CACCGCACCGTCCCTCACCG-3′; E: 5′-CTCCTCGGTGAGGGACGGTG-3′; 5: 5′-ACACCCTTGTTGAATCTATT-3′), MALT1 (3: 5′-GGCGAGGGCCATGTCGCTGT-3′; 4: 5′-GCGCGACCCTCAACCGCCTG-3′; 5: 5′-CAGTGTGTTCCATAGCCTGC-3′; 6: 5′-GCAGTGCATGTAAAAGATGC-3′; 7: 5′-GCAGTGTTCTCTTAAGGTAC-3′; 8: 5′-TCACCTTTGAATTCAGCCAG-3′), and TAK1 (1: 5′-AGAGCCTGATGACTCGTTGT-3′) were adopted from the human GeCKOv2 library (Sanjana et al., 2014) and were delivered using the LentiCRISPRv2B (LCv2B) vector (Chan et al., 2021). The LCv2B vector was also used for the delivery of gRNA targeting CD3E (5′-AGATGCAGTCGGGCACTCAC-3′) or CD28 (5′-CCCCTTAGGGCACATGATCA-3′). CD80 or PD-L1 expression (Fig. S4) was induced using the LentiSAMPHv2 (LSv2) CRISPRa vector system described previously (Addgene #167934; Chan et al., 2021). CRISPRa gRNAs (CD80: 5′-GCCTCCCTCACCACCGTGCA-3′; PD-L1: 5′-CTATACACAGCTTTATTCCT-3′; 5′-CTGACCTTCGGTGAAATCGG-3′; 5′-TCAGTTTAGGTATCTAGTGT-3′) were adopted from the human SAM library (Joung et al., 2017). LCv2B- or LSv2-transduced Jurkat cells were selected using 3 μg/ml of blasticidin.
Western blotting analysis
Jurkat cells were lysed in a buffer containing 50 mM Tris pH7.5, 150 mM NaCl, 1 mM EDTA, 10% glycerol, and 1% Igepal. Western blots were analyzed using mouse anti-human Bcl10 clone 331.3 (sc-5273; Santa Cruz Biotechnology), mouse anti-human MALT1 clone B-12 (sc-46677, Santa Cruz Biotechnology), rabbit anti-human TAK1 clone D94D7 (#5206; Cell Signaling Technology), rabbit anti-human NF-κB p65/RelA clone D14E12 (#8242; Cell Signaling Technology), mouse anti-human NF-κB p50/p105 clone E−10 (sc-8414; Santa Cruz Biotechnology), and rabbit anti-Akt (#9272; Cell Signaling Technology) antibodies.
Preparation and transduction of lentiviral vectors
Lentiviral particles were produced in HEK293T and purified using Lenti-X Concentrator reagent (631232; Takara) as described previously (Chan et al., 2021). Jurkat reporter cell lines were cotransduced with pHR-TCR55α and pHR-TCR55β or pHR-TCR6α and pHR-TCR6β lentiviral expression vectors at saturating concentration. Prior to lentiviral transduction, human PBMC were stimulated with 1 μg/ml anti-CD3 (300334; BioLegend) and 1 μg/ml anti-CD28 (302944; BioLegend) soluble antibodies for 18–24 h. Purified and concentrated lentiviral particles containing the pHR-TCR55α, pHR-TCR55β, and LE-hPDCD1 vectors were then added to the human PBMC culture along with 8 μg/ml of Polybrene (TR-1003; Millipore Sigma) and 100 U/ml of recombinant human IL-2 (TECIN [teceleukin]) and spun at 400 ×g for 90 min at 34°C.
Live cell confocal microscopy
Live cell fluorescence time-lapse imaging data were collected using a Leica SP8 confocal microscope with a 63× NA 1.4 oil objective (Biological Imaging Section, Research Technologies Branch, National Institute of Allergy and Infectious Diseases [NIAID]). Glass-bottom 8-well (80827; ibidi) or 18-well (81817; ibidi) imaging chambers were coated with poly-D-lysine (P7280; Sigma-Aldrich) overnight at 4°C and washed twice with PBS. Approximately, 5 × 10⁵ cells were plated in each well and incubated for 1 h before images were collected. Cells were imaged in a heated 37°C environment humidified with 5% CO2. Excitation wavelengths were 405, 488, and 561 nm for BFP, GFP, and mScarlet respectively, with appropriate emission wavelengths used consistently for each imaging session. Three imaging positions were randomly chosen for each well. Imaging data were processed by Imaris Cell module (Oxford Instruments), customized Imaris Batch (Oxford Instruments) analysis, and the TranslocQ pipelines.
TranslocQ image analysis pipelines
The development of the TranslocQ pipelines was initially focused on the analysis of GFP-RelA translocation dynamics following PMA/ionomycin or αCD3/αCD28 antibody stimulation. We empirically determined that the mean but not the sum intensity ratio (nuclear/cytoplasmic, or N/C) accurately recapitulated the RelA nuclear translocation dynamics that we observed in live cell time-lapse images (Fig. S1 A). Our analysis suggested that the sum GFP-RelA N/C intensity ratio was masked by the variance in cell volume. No correlation was found between the mean intensity ratio and the volume ratio, indicating that an increase in the mean GFP-RelA intensity ratio was not an artifact caused by the variation in volume ratio (Fig. S1 A). For missing value interpolation, we compared the imputation accuracy of six commonly used interpolation methods: linear interpolation, spline interpolation, last observation carried forward, next observation carried backward, linear weighted moving average, and exponential weighted moving average (Fig. S1 B). At the low level of missing proportion (<15% commonly observed), exponential weighted moving average generated the least imputation error and was chosen as the interpolation method for TranslocQ. We applied the peak detection function to the smoothed single-cell traces that were produced from 15 different pairs of smoothing parameters (Fig. S1 B) and compared their performance in recapitulating the original behavior of the cells. The 14th set of parameters (degree = 2, span = 0.3) resulted in the strongest agreement between the algorithm and manual results and was chosen as the smoothing parameter for TranslocQ.
Cell isolation and flow cytometry analysis
Cell sorting was conducted using a BD FACSAria III or Fusion sorter operated within a Class II biological safety cabinet at the Flow Cytometry Section of the Research Technologies Branch of NIAID. For cell isolation based on cell surface marker staining, MACS was conducted using LD or LS columns (Miltenyi Biotec) in combination with the appropriate antibodies and MicroBeads (Miltenyi Biotec). For CD3 depletion or enrichment, human CD3 MicroBeads (130-050-101; Miltenyi Biotec) were used. For CD28 depletion or enrichment, APC-labeled mouse anti-human CD28 clone CD28.2 (559770; BD Biosciences) antibody was used in combination with anti-APC MicroBeads (130-090-855; Miltenyi Biotec). For PD-1 or PD-L1 enrichment, APC-labeled mouse anti-human CD279 clone MIH4 (17-9969-42; Thermo Fisher Scientific) or APC-labeled mouse anti-human CD274 clone MIH1 (17-5983-42; Thermo Fisher Scientific) antibodies were used with anti-APC MicroBeads. For CD80 or CD86 enrichment, APC-labeled mouse anti-human CD80 clone MEM-233 (ab27554; Abcam) or APC-labeled mouse anti-human CD86 clone 2331 (555660; BD Biosciences) antibodies were used with anti-APC MicroBeads. FACS analysis data were collected using a BD LSRFortessa cell analyzer and processed with FlowJo (BD Biosciences). In addition to the APC-labeled antibodies described above, cell surface markers were stained using A647 mouse anti-human CD3 clone UCHT1 (557706; BD Biosciences), A488 mouse anti-human PD-L1 clone MIH1 (53-5983-42; Thermo Fisher Scientific), and recombinant human CTLA-4 Fc chimera protein (325-CT-200; R&D Systems) in combination with APC-labeled mouse anti-human IgG Fc antibodies (FAB110A; R&D Systems).
Stimulation reagents and chemical inhibitors
For stimulating the CD3 and/or CD28 receptors, purified NA/LE mouse anti-human CD3 clone UCHT1 (555329; BD Biosciences) and/or purified NA/LE mouse anti-human CD28 (555725; BD Biosciences), and purified rat anti-mouse IgG1 (553440; BD Biosciences) antibodies were used at 1 μg/ml final concentration each unless otherwise specified. Jurkat cells were stimulated with 50 ng/ml PMA (CAS 16561-29-8; Santa Cruz Biotechnology) and 1 μM ionomycin (I9657; Sigma-Aldrich). For stimulating the TNF receptor, human TNFα recombinant protein (PHC3015; Thermo Fisher Scientific) was used at 100 ng/ml unless otherwise specified. For αCD3/αCD28 stimulation under chemical inhibitor conditions, Jurkat cells were pretreated with 10 μM of U0126 (70970; Cayman Chemical), 10 μM of JNK Inhibitor VIII (15946; Cayman Chemical), 25 μM of SB 203580 (13067; Cayman Chemical), or 50 μM of Cyclosporin A (12088; Cayman Chemical) for 1 h at 37°C before imaging began.
Peptide loading on APC for coculture assays
Jurkat cells naturally express HLA-B35 MHC Class I molecules but not CD80, CD86, or PD-L1, give minimal background signal or interruption to reporter cell attachment to the glass bottom, and are easily modified by lentiviral transduction. They also show stable CD80, CD86, or PD-L1 ectopic expression for many passages in culture. Therefore, we chose Jurkat cells as APC for MHCI peptide loading and coculture stimulation of reporter or PBMC-derived T cells. For MHCII peptide loading and coculture experiments, we used the K562-DR4 cells as APC. For all peptide loading preparations, Jurkat or K562-DR4 APC were incubated with the indicated concentration of TCR55 or TCR6 ligand peptides HIVpol, ATL, SQL, Pep20, 6.4, or HIVgag (Elim Biopharm) for 2–3 h at 37°C. These peptide-loaded APC were then washed twice in culture medium at room temperature and added to imaging chambers at the indicated time point for coculture experiments. To increase the chance of APC: T cell engagement, we used a 2:1 ratio for all coculture experiments. Since Jurkat APC also express CD28, which increases the total number of CD28 molecules by threefold in coculture experiments, we applied 3 μg/ml of αCD28 antibody to Jurkat APCs immediately before their addition to the imaging chamber in these experiments (Fig. 4 and Fig. S2). For PD-L1 blocking experiments, mouse anti-human CD274 clone MIH1 (17-5983-42; Thermo Fisher Scientific) antibody was added to peptide-pulsed APC immediately before their addition to the imaging chamber at the indicated time point. For MHCI blocking experiments, mouse anti-human MHCI clone W6/32 (sc-32235; Santa Cruz Biotechnology) antibody was added to APC immediately before coculture time course with human PBMC-derived T cells.
Cell surface marker and intracellular pERK staining
Human PBMC-derived T cells and APC were immediately cooled down in an ice-water bath at the end of the coculture time course, washed twice in cold FACS buffer (PBS, 5% FBS, and 2 mM EDTA), and fixed with 1.6% paraformaldehyde for 10 min at room temperature. Cells were then washed twice in FACS buffer and stained with APC-labeled mouse anti-human CD8a clone RPA-T8 (17-0088-41; Thermo Fisher Scientific), BV421 mouse anti-human CD28 clone CD28.2 (562613; BD Biosciences), and A488 mouse anti-human PD-1 clone MIH4 (53-9969-42; Thermo Fisher Scientific) antibodies for 2 h at room temperature. Cell surface marker-stained cells were washed twice in FACS buffer and fixed again with 1.6% paraformaldehyde for 10 min at room temperature. Cells were then washed twice in FACS buffer and permeabilized overnight with ice-cold methanol at −20°C. Permeabilized cells were washed twice in FACS buffer and stained with PE rabbit anti-human phospho-ERK1/2 T202/Y204 clone 197G2 (14095S; Cell Signaling Technology), along with the above cell surface marker staining antibodies for 2 h at room temperature.
Model fitting for pERK data analysis
For the single-cell analysis, flow cytometry measurements of human PBMC were first gated on CD8+ PD-1+ cells using the R package flowCore (Hahne et al., 2009). Quantitative single-cell fluorescence levels of pERK, CD28, and PD-1 were then log-transformed and standardized. A linear Bayesian statistical model was fit to determine how quantitative CD28 (x1) and PD-1 (x2) expression impacts phosphorylation of ERK (y) 5 min after stimulation with APC that either do or do not express PD-L1 (x3). A quadratic term for PD-1 expression was also included to account for mild nonlinearities in its effect. This model decisively outcompeted an analogous model without the quadratic term according to the widely applicable information criterion . Thus, the final model was as follows:
This model was fit using the R package brms (Bürkner, 2017) using 5,000 Markov chain Monte Carlo iterations, including 1,000 warm-up iterations. Weakly regularizing Gaussian priors were centered at 1 for β0 and 0 for all other parameters. After model fitting, 10,000 samples were drawn from the model’s posterior distribution and used to predict the expectation and 95% credible interval for pERK expression as it depends on CD28, PD-1, and PD-L1 expressions.
Data concatenation and visualization
The mean of the population-averaged temporal reporter data was used for the following analysis. As the reporter activities (ERK, NFAT2, and p38) were measured in multiple experiments and technical repeats, when concatenating the data, all possible combinations were considered. When concatenating the data of these three sets of reporters each with three replicates, a total of 3 × 3 × 3 = 27 combinations had been considered. PCA was performed to visualize the impact of different antigenicity, for TCR alone, and TCR modulated by PD-L1:PD-1 engagement. The reporter activity data were standardized by removing the mean and scaling to unit variance before PCA.
Statistical analysis and cartoon illustration
Data representation, visualization, statistical analysis, and significance definition were stated in figure legends. Unless specifically indicated, all statistics were analyzed using GraphPad Prism. Cartoon illustrations were created via BioRender.
Online supplemental material
Fig. S1 shows TranslocQ development and supporting data for reporter specificity assessment. Fig. S2 shows expression profiles of CD3, CD28, PD-1, and signaling profiles of TCR55 versus TCR55+CD28 engagement. Fig. S3 shows SQL versus Pep20 titration data, PD-L1 expression profiles, αPD-L1 control data, and PD-1 inhibitory effects on various levels of TCR55 signaling. Fig. S4 shows KL divergence, PD-L1 versus CD80 expression profiles, and PD-1 inhibitory effects on various levels of TCR55+CD28 signaling. Fig. S5 shows CD3, CD28, CD86, PD-1, CD80, and PD-L1 expression profiles, PCA results, and basal ERK activities.
Supplementary Material
contains original blots for Fig. S1.
Acknowledgments
We thank Pamela L. Schwartzberg and Ronald D. Vale for critical reading of the manuscript.
This research was supported by the Intramural Research Program of the NIAID, NIH. K.C. Garcia is supported by NIH grant 5R01AI103867, Howard Hughes Medical Institute, Parker Foundation for Cancer Immunotherapy, and a Bio-X seed grant. D. Jia and G. Altan-Bonnet are supported by the intramural research program of the National Cancer Institute.
Author contributions: Conceptualization, W. Chan and R.N. Germain; methodology, W. Chan, Y.M. Cao, X. Zhao, E.C. Schrom, and D. Jia; software, W. Chan, Y.M. Cao, E.C. Schrom, and J. Song; validation, W. Chan, Y.M. Cao, and R.N. Germain; formal analysis, W. Chan, Y.M. Cao, E.C. Schrom, D. Jia, and J. Song; investigation, W. Chan, Y.M. Cao, and M. Smelkinson; resources, X. Zhao, L.V. Sibener, S. Dong, R.A. Fernandes, C.J. Bradfield, M. Smelkinson, J. Kabat, J.L. Hor, G. Altan-Bonnet, K.C. Garcia, and R.N. Germain; data curation, W. Chan and J. Kabat; writing—original draft, W. Chan and R.N. Germain; writing—review & editing, W. Chan, E.C. Schrom, D. Jia, J. Song, R.A. Fernandes, C.J. Bradfield, G. Altan-Bonnet, K.C. Garcia and R.N. Germain; visualization, W. Chan, Y.M. Cao, E.C. Schrom, and D. Jia; supervision, G. Altan-Bonnet, K.C. Garcia, and R.N. Germain; project administration, W. Chan and R.N. Germain; funding acquisition, G. Altan-Bonnet, K.C. Garcia, and R.N. Germain
Data availability
All data are available in the main text or the supplementary materials. Requests for resources and reagents should be directed to the corresponding author. Cell lines and recombinant DNA are available upon request, subject to approval by the NIAID Technology Transfer and Intellectual Property Office and execution of a Material Transfer Agreement.
References
- Abraham, R.T., and Weiss A.. 2004. Jurkat T cells and development of the T-cell receptor signalling paradigm. Nat. Rev. Immunol. 4:301–308. 10.1038/nri1330 [DOI] [PubMed] [Google Scholar]
- Achar, S.R., Bourassa F.X.P., Rademaker T.J., Lee A., Kondo T., Salazar-Cavazos E., Davies J.S., Taylor N., François P., and Altan-Bonnet G.. 2022. Universal antigen encoding of T cell activation from high-dimensional cytokine dynamics. Science. 376:880–884. 10.1126/science.abl5311 [DOI] [PubMed] [Google Scholar]
- Altan-Bonnet, G., and Germain R.N.. 2005. Modeling T cell antigen discrimination based on feedback control of digital ERK responses. PLoS Biol. 3:e356. 10.1371/journal.pbio.0030356 [DOI] [PMC free article] [PubMed] [Google Scholar]
- Ballard, D.W., Dixon E.P., Peffer N.J., Bogerd H., Doerre S., Stein B., and Greene W.C.. 1992. The 65-kDa subunit of human NF-κ B functions as a potent transcriptional activator and a target for v-Rel-mediated repression. Proc. Natl. Acad. Sci. USA. 89:1875–1879. 10.1073/pnas.89.5.1875 [DOI] [PMC free article] [PubMed] [Google Scholar]
- Beals, C.R., Clipstone N.A., Ho S.N., and Crabtree G.R.. 1997. Nuclear localization of NF-ATc by a calcineurin-dependent, cyclosporin-sensitive intramolecular interaction. Genes Dev. 11:824–834. 10.1101/gad.11.7.824 [DOI] [PubMed] [Google Scholar]
- Blonska, M., Pappu B.P., Matsumoto R., Li H., Su B., Wang D., and Lin X.. 2007. The CARMA1-Bcl10 signaling complex selectively regulates JNK2 kinase in the T cell receptor-signaling pathway. Immunity. 26:55–66. 10.1016/j.immuni.2006.11.008 [DOI] [PMC free article] [PubMed] [Google Scholar]
- Bretscher, P., and Cohn M.. 1970. A theory of self-nonself discrimination. Science. 169:1042–1049. 10.1126/science.169.3950.1042 [DOI] [PubMed] [Google Scholar]
- Bretscher, P.A. 1999. A two-step, two-signal model for the primary activation of precursor helper T cells. Proc. Natl. Acad. Sci. USA. 96:185–190. 10.1073/pnas.96.1.185 [DOI] [PMC free article] [PubMed] [Google Scholar]
- Bürkner, P.-C. 2017. brms: An R package for bayesian multilevel models using stan. J. Stat. Softw. 80:1–28. 10.18637/jss.v080.i01 [DOI] [Google Scholar]
- Cabantous, S., Nguyen H.B., Pedelacq J.-D., Koraïchi F., Chaudhary A., Ganguly K., Lockard M.A., Favre G., Terwilliger T.C., and Waldo G.S.. 2013. A new protein-protein interaction sensor based on tripartite split-GFP association. Sci. Rep. 3:2854. 10.1038/srep02854 [DOI] [PMC free article] [PubMed] [Google Scholar]
- Cabantous, S., Terwilliger T.C., and Waldo G.S.. 2005. Protein tagging and detection with engineered self-assembling fragments of green fluorescent protein. Nat. Biotechnol. 23:102–107. 10.1038/nbt1044 [DOI] [PubMed] [Google Scholar]
- Celis-Gutierrez, J., Blattmann P., Zhai Y., Jarmuzynski N., Ruminski K., Grégoire C., Ounoughene Y., Fiore F., Aebersold R., Roncagalli R., et al. 2019. Quantitative interactomics in primary T cells provides a rationale for concomitant PD-1 and BTLA coinhibitor blockade in cancer immunotherapy. Cell Rep. 27:3315–3330.e7. 10.1016/j.celrep.2019.05.041 [DOI] [PMC free article] [PubMed] [Google Scholar]
- Chan, W., Gottschalk R.A., Yao Y., Pomerantz J.L., and Germain R.N.. 2021. Efficient immune cell genome engineering with enhanced CRISPR editing tools. Immunohorizons. 5:117–132. 10.4049/immunohorizons.2000082 [DOI] [PubMed] [Google Scholar]
- Chan, W., Schaffer T.B., and Pomerantz J.L.. 2013. A quantitative signaling screen identifies CARD11 mutations in the CARD and LATCH domains that induce Bcl10 ubiquitination and human lymphoma cell survival. Mol. Cell. Biol. 33:429–443. 10.1128/MCB.00850-12 [DOI] [PMC free article] [PubMed] [Google Scholar]
- Chaudhri, A., Xiao Y., Klee A.N., Wang X., Zhu B., and Freeman G.J.. 2018. PD-L1 Binds to B7-1 only in cis on the same cell surface. Cancer Immunol. Res. 6:921–929. 10.1158/2326-6066.CIR-17-0316 [DOI] [PMC free article] [PubMed] [Google Scholar]
- Chemnitz, J.M., Riley J.L., Frauwirth K.A., Braunstein I., Kobayashi S.V., Linsley P.S., Thompson C.B., and Parry R.V.. 2004. CTLA-4 and PD-1 receptors inhibit T-cell activation by distinct mechanisms. Blood. 104:2657. 10.1182/blood.v104.11.2657.2657 [DOI] [PMC free article] [PubMed] [Google Scholar]
- Chi, S., Weiss A., and Wang H.. 2016. A CRISPR-based toolbox for studying T cell signal transduction. BioMed Res. Int. 2016:5052369. 10.1155/2016/5052369 [DOI] [PMC free article] [PubMed] [Google Scholar]
- Collins, A.V., Brodie D.W., Gilbert R.J.C., Iaboni A., Manso-Sancho R., Walse B., Stuart D.I., van der Merwe P.A., and Davis S.J.. 2002. The interaction properties of costimulatory molecules revisited. Immunity. 17:201–210. 10.1016/S1074-7613(02)00362-X [DOI] [PubMed] [Google Scholar]
- Das, J., Ho M., Zikherman J., Govern C., Yang M., Weiss A., Chakraborty A.K., and Roose J.P.. 2009. Digital signaling and hysteresis characterize ras activation in lymphoid cells. Cell. 136:337–351. 10.1016/j.cell.2008.11.051 [DOI] [PMC free article] [PubMed] [Google Scholar]
- Diehn, M., Alizadeh A.A., Rando O.J., Liu C.L., Stankunas K., Botstein D., Crabtree G.R., and Brown P.O.. 2002. Genomic expression programs and the integration of the CD28 costimulatory signal in T cell activation. Proc. Natl. Acad. Sci. USA. 99:11796–11801. 10.1073/pnas.092284399 [DOI] [PMC free article] [PubMed] [Google Scholar]
- Fife, B.T., Pauken K.E., Eagar T.N., Obu T., Wu J., Tang Q., Azuma M., Krummel M.F., and Bluestone J.A.. 2009. Interactions between programmed death-1 and programmed death ligand-1 promote tolerance by blocking the T cell receptor-induced stop signal. Nat. Immunol. 10:1185–1192. 10.1038/ni.1790.Interactions [DOI] [PMC free article] [PubMed] [Google Scholar]
- Hahne, F., LeMeur N., Brinkman R.R., Ellis B., Haaland P., Sarkar D., Spidlen J., Strain E., and Gentleman R.. 2009. flowCore: A bioconductor package for high throughput flow cytometry. BMC Bioinformatics. 10:106. 10.1186/1471-2105-10-106 [DOI] [PMC free article] [PubMed] [Google Scholar]
- Hamilton, K.S., Phong B., Corey C., Cheng J., Gorentla B., Zhong X., Shiva S., and Kane L.P.. 2014. T cell receptor-dependent activation of mTOR signaling in T cells is mediated by Carma1 and MALT1, but not Bcl10. Sci. Signal. 7:ra55. 10.1126/scisignal.2005169 [DOI] [PMC free article] [PubMed] [Google Scholar]
- Hemmer, B., Stefanova I., Vergelli M., Germain R.N., and Martin R.. 1998. Relationships among TCR ligand potency, thresholds for effector function elicitation, and the quality of early signaling events in human T cells. J. Immunol. 160:5807–5814. 10.4049/jimmunol.160.12.5807 [DOI] [PubMed] [Google Scholar]
- Honda, T., Egen J.G., Lämmermann T., Kastenmüller W., Torabi-Parizi P., and Germain R.N.. 2014. Tuning of antigen sensitivity by T cell receptor-dependent negative feedback controls T cell effector function in inflamed tissues. Immunity. 40:235–247. 10.1016/j.immuni.2013.11.017 [DOI] [PMC free article] [PubMed] [Google Scholar]
- Horn, L.A., Long T.M., Atkinson R., Clements V., and Ostrand-Rosenberg S.. 2018. Soluble CD80 protein delays tumor growth and promotes tumor-infiltrating lymphocytes. Cancer Immunol. Res. 6:59–68. 10.1158/2326-6066.CIR-17-0026 [DOI] [PMC free article] [PubMed] [Google Scholar]
- Hui, E., Cheung J., Zhu J., Su X., Taylor M.J., Wallweber H.A., Sasmal D.K., Huang J., Kim J.M., Mellman I., and Vale R.D.. 2017. T cell costimulatory receptor CD28 is a primary target for PD-1-mediated inhibition. Science. 355:1428–1433. 10.1126/science.aaf1292 [DOI] [PMC free article] [PubMed] [Google Scholar]
- Hwang, J.R., Byeon Y., Kim D., and Park S.G.. 2020. Recent insights of T cell receptor-mediated signaling pathways for T cell activation and development. Exp. Mol. Med. 52:750–761. 10.1038/s12276-020-0435-8 [DOI] [PMC free article] [PubMed] [Google Scholar]
- Joung, J., Konermann S., Gootenberg J.S., Abudayyeh O.O., Platt R.J., Brigham M.D., Sanjana N.E., and Zhang F.. 2017. Genome-scale CRISPR-Cas9 knockout and transcriptional activation screening. Nat. Protoc. 12:828–863. 10.1038/nprot.2017.016 [DOI] [PMC free article] [PubMed] [Google Scholar]
- Kamphorst, A.O., Wieland A., Nasti T., Yang S., Zhang R., Barber D.L., Konieczny B.T., Daugherty C.Z., Koenig L., Yu K., et al. 2017. Rescue of exhausted CD8 T cells by PD-1-targeted therapies is CD28-dependent. Science. 355:1423–1427. 10.1126/science.aaf0683 [DOI] [PMC free article] [PubMed] [Google Scholar]
- Latchman, Y., Wood C.R., Chernova T., Chaudhary D., Borde M., Chernova I., Iwai Y., Long A.J., Brown J.A., Nunes R., et al. 2001. PD-L2 is a second ligand for PD-1 and inhibits T cell activation. Nat. Immunol. 2:261–268. 10.1038/85330 [DOI] [PubMed] [Google Scholar]
- Lenschow, D.J., Walunas T.L., and Bluestone J.A.. 1996. CD28/B7 system of T cell costimulation. Annu. Rev. Immunol. 14:233–258. 10.1146/annurev.immunol.14.1.233 [DOI] [PubMed] [Google Scholar]
- Macian, F. 2005. NFAT proteins: Key regulators of T-cell development and function. Nat. Rev. Immunol. 5:472–484. 10.1038/nri1632 [DOI] [PubMed] [Google Scholar]
- Marinari, B., Costanzo A., Marzano V., Piccolella E., and Tuosto L.. 2004. CD28 delivers a unique signal leading to the selective recruitment of RelA and p52 NF-kappaB subunits on IL-8 and Bcl-xL gene promoters. Proc. Natl. Acad. Sci. USA. 101:6098–6103. 10.1073/pnas.0308688101 [DOI] [PMC free article] [PubMed] [Google Scholar]
- Mizuno, R., Sugiura D., Shimizu K., Maruhashi T., Watada M., Okazaki I.M., and Okazaki T.. 2019. PD-1 primarily targets TCR signal in the inhibition of functional T cell activation. Front. Immunol. 10:630. 10.3389/fimmu.2019.00630 [DOI] [PMC free article] [PubMed] [Google Scholar]
- Pagès, F., Ragueneau M., Rottapel R., Truneh A., Nunes J., Imbert J., and Olive D.. 1994. Binding of phosphatidylinositol-3-OH kinase to CD28 is required for T-cell signalling. Nature. 369:327–329. 10.1038/369327a0 [DOI] [PubMed] [Google Scholar]
- Pomerantz, J.L., Denny E.M., and Baltimore D.. 2002. CARD11 mediates factor-specific activation of NF-kappaB by the T cell receptor complex. EMBO J. 21:5184–5194. 10.1093/emboj/cdf505 [DOI] [PMC free article] [PubMed] [Google Scholar]
- Qureshi, O.S., Zheng Y., Nakamura K., Attridge K., Manzotti C., Schmidt E.M., Baker J., Jeffery L.E., Kaur S., Briggs Z., et al. 2011. Trans-endocytosis of CD80 and CD86: A molecular basis for the cell-extrinsic function of CTLA-4. Science. 332:600–603. 10.1126/science.1202947 [DOI] [PMC free article] [PubMed] [Google Scholar]
- Regot, S., Hughey J.J., Bajar B.T., Carrasco S., and Covert M.W.. 2014. High-sensitivity measurements of multiple kinase activities in live single cells. Cell. 157:1724–1734. 10.1016/j.cell.2014.04.039 [DOI] [PMC free article] [PubMed] [Google Scholar]
- Riha, P., and Rudd C.E.. 2010. CD28 co-signaling in the adaptive immune response. Self Nonself. 1:231–240. 10.4161/self.1.3.12968 [DOI] [PMC free article] [PubMed] [Google Scholar]
- Rudd, C.E., Taylor A., and Schneider H.. 2009. CD28 and CTLA-4 coreceptor expression and signal transduction. Immunol. Rev. 229:12–26. 10.1111/j.1600-065X.2009.00770.x [DOI] [PMC free article] [PubMed] [Google Scholar]
- Sanjana, N.E., Shalem O., and Zhang F.. 2014. Improved vectors and genome-wide libraries for CRISPR screening. Nat. Methods. 11:783–784. 10.1038/nmeth.3047 [DOI] [PMC free article] [PubMed] [Google Scholar]
- Sheppard, K.A., Fitz L.J., Lee J.M., Benander C., George J.A., Wooters J., Qiu Y., Jussif J.M., Carter L.L., Wood C.R., and Chaudhary D.. 2004. PD-1 inhibits T-cell receptor induced phosphorylation of the ZAP70/CD3ζ signalosome and downstream signaling to PKCtheta. FEBS Lett. 574:37–41. 10.1016/j.febslet.2004.07.083 [DOI] [PubMed] [Google Scholar]
- Shimizu, K., Sugiura D., Okazaki I.M., Maruhashi T., Takemoto T., and Okazaki T.. 2021. PD-1 preferentially inhibits the activation of low-affinity T cells. Proc. Natl. Acad. Sci. USA. 118:e2107141118. 10.1073/pnas.2107141118 [DOI] [PMC free article] [PubMed] [Google Scholar]
- Shimizu, K., Sugiura D., Okazaki I.M., Maruhashi T., Takegami Y., Cheng C., Ozaki S., and Okazaki T.. 2020. PD-1 imposes qualitative control of cellular transcriptomes in response to T cell activation. Mol. Cell. 77:937–950.e6. 10.1016/j.molcel.2019.12.012 [DOI] [PubMed] [Google Scholar]
- Sibener, L.V., Fernandes R.A., Kolawole E.M., Carbone C.B., Liu F., McAffee D., Birnbaum M.E., Yang X., Su L.F., Yu W., et al. 2018. Isolation of a structural mechanism for uncoupling T cell receptor signaling from peptide-MHC binding. Cell. 174:672–687.e27. 10.1016/j.cell.2018.06.017 [DOI] [PMC free article] [PubMed] [Google Scholar]
- Sugiura, D., Maruhashi T., Okazaki I.M., Shimizu K., Maeda T.K., Takemoto T., and Okazaki T.. 2019. Restriction of PD-1 function by cis-PD-L1/CD80 interactions is required for optimal T cell responses. Science. 364:558–566. 10.1126/science.aav7062 [DOI] [PubMed] [Google Scholar]
- Wing, K., Onishi Y., Prieto-Martin P., Yamaguchi T., Miyara M., Fehervari Z., Nomura T., and Sakaguchi S.. 2008. CTLA-4 control over Foxp3+ regulatory T cell function. Science. 322:271–275. 10.1126/science.1160062 [DOI] [PubMed] [Google Scholar]
- Yang, Y.-K., Yang C., Chan W., Wang Z., Deibel K.E., and Pomerantz J.L.. 2016. Molecular determinants of scaffold-induced linear ubiquitinylation of B cell lymphoma/leukemia 10 (Bcl10) during T cell receptor and oncogenic caspase recruitment domain-containing protein 11 (CARD11) signaling. J. Biol. Chem. 291:25921–25936. 10.1074/jbc.M116.754028 [DOI] [PMC free article] [PubMed] [Google Scholar]
- Yokosuka, T., Kobayashi W., Sakata-Sogawa K., Takamatsu M., Hashimoto-Tane A., Dustin M.L., Tokunaga M., and Saito T.. 2008. Spatiotemporal regulation of T cell costimulation by TCR-CD28 microclusters and protein kinase C θ translocation. Immunity. 29:589–601. 10.1016/j.immuni.2008.08.011 [DOI] [PMC free article] [PubMed] [Google Scholar]
- Yokosuka, T., Takamatsu M., Kobayashi-Imanishi W., Hashimoto-Tane A., Azuma M., and Saito T.. 2012. Programmed cell death 1 forms negative costimulatory microclusters that directly inhibit T cell receptor signaling by recruiting phosphatase SHP2. J. Exp. Med. 209:1201–1217. 10.1084/jem.20112741 [DOI] [PMC free article] [PubMed] [Google Scholar]
- Zhao, Y., Lee C.K., Lin C.-H., Gassen R.B., Xu X., Huang Z., Xiao C., Bonorino C., Lu L.-F., Bui J.D., and Hui E.. 2019. PD-L1:CD80 Cis-Heterodimer triggers the Co-stimulatory receptor CD28 while repressing the inhibitory PD-1 and CTLA-4 pathways. Immunity. 51:1059–1073.e9. 10.1016/j.immuni.2019.11.003 [DOI] [PMC free article] [PubMed] [Google Scholar]
- Zheng, Y., Delgoffe G.M., Meyer C.F., Chan W., and Powell J.D.. 2009. Anergic T cells are metabolically anergic. J. Immunol. 183:6095–6101. 10.4049/jimmunol.0803510 [DOI] [PMC free article] [PubMed] [Google Scholar]
- Zumerle, S., Molon B., and Viola A.. 2017. Membrane rafts in T cell activation: A spotlight on CD28 costimulation. Front. Immunol. 8:1467. 10.3389/fimmu.2017.01467 [DOI] [PMC free article] [PubMed] [Google Scholar]
Associated Data
This section collects any data citations, data availability statements, or supplementary materials included in this article.
Supplementary Materials
contains original blots for Fig. S1.
Data Availability Statement
All data are available in the main text or the supplementary materials. Requests for resources and reagents should be directed to the corresponding author. Cell lines and recombinant DNA are available upon request, subject to approval by the NIAID Technology Transfer and Intellectual Property Office and execution of a Material Transfer Agreement.


