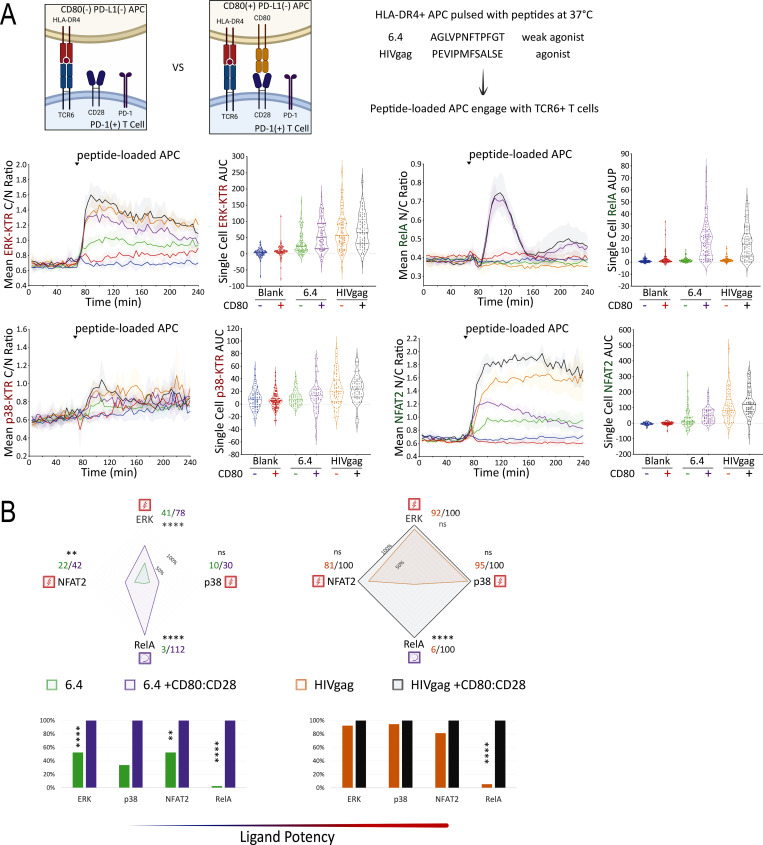
Figure 8.
Mapping of TCR6- versus TCR6-CD28–induced signaling in the presence of PD-1. (A) TCR6 ligand peptide sequences are shown. Population response curves (mean ± s.d.) versus single-cell AUC/AUP distributions (violin plots with median and quartiles) comparing the indicated peptide ligand variant in the absence or presence of CD80 following the addition of peptide-loaded APC at the indicated time point. Blank indicates the addition of APC without peptide pulsing. (B) Radar plots represent normalized mean values of corresponding single-cell AUC/AUP distributions in the absence or presence of CD80:CD28 signaling as indicated. Bar graphs show further normalization of these mean values within each comparison pair. ns: P value ≥0.05, **P value between 0.001 and 0.01, ****P value <0.0001, two-tailed unpaired t test. Results are representative of two independent experiments.

