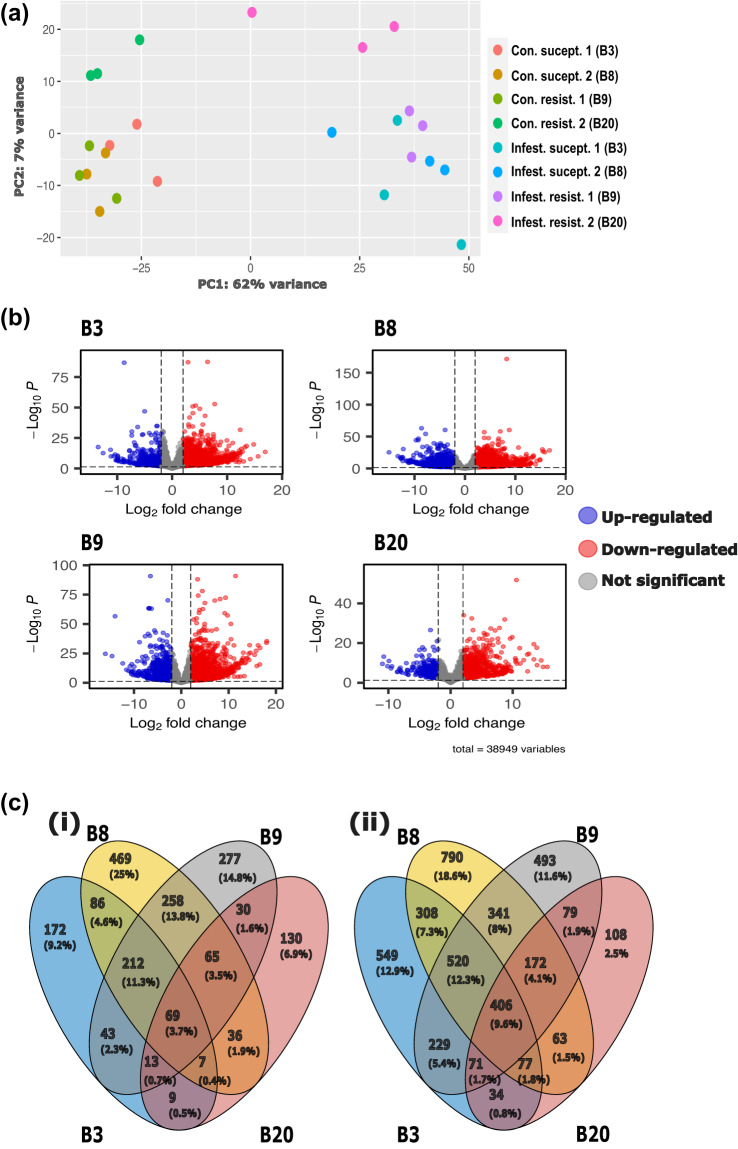
Fig. 3.
Differential gene expression in EAB susceptible and EAB resistant ash trees. (a) Principal component analysis of all biological replicates showing susceptible and resistant control genotypes, and susceptible and resistant EAB infested genotypes. (b) Volcano plots showing differentially expressed genes where red indicates significant differential expression in genotype (i) B3, (ii) B8, (iii) B9, and (iv) B20. (c) Venn diagrams showing independent and overlapping (i) upregulated genes, and (ii) downregulated genes.

