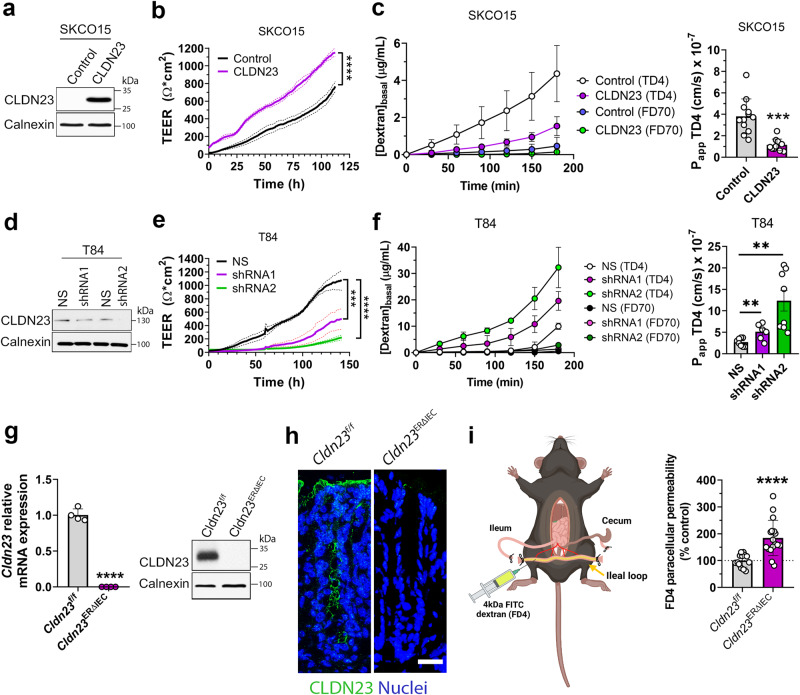
Fig. 2. CLDN23 regulates intestinal epithelial barrier function.
a Immunoblotting for CLDN23 and Calnexin (loading control) in SKCO15 cells with ectopic expression of full-length human CLDN23 protein versus a 10 amino acid myc-tag protein (Control). b Representative graph showing TEER of SKCO15 cells overexpressing CLDN23 vs control monolayers was measured continuously for 5 days. Data are mean ± SD and represent three individual experiments, each with six technical replicates. ****p ≤ 0.0001; two-way ANOVA with Tukey’s posttest. c Left, paracellular flux rate of 4 kDa TRITC-dextran (TD4) and 70 kDa FITC-dextran (FD70) across monolayers overexpressing CLDN23 and control SKCO15 cells ([Dextran]basal). Right, rate of change of TD4 flux was utilized to calculate the apparent permeability (Papp) of each individual sample. Data are mean ± SD and are representative of three individual experiments, each with six technical replicates. ***p = 0.001; two-tailed Student’s t test with Welch’s correction. d CLDN23 expression in T84 IECs transduced with two shRNAs against CLDN23 were compared with scramble non-silencing shRNA control cells (NS). Immunoblot images are representative of three independent experiments. e Representative graph showing TEER of T84 CLDN23 KD (shRNA1 and 2) and NS monolayers was measured continuously for 5 days. Data are mean ± SD and represent two independent experiments, each with four technical replicates per condition. ***p ≤ 0.001; ****p ≤ 0.0001; two-way ANOVA with Tukey’s posttest. f Paracellular flux rate of 4 kDa TRITC-dextran (TD4) and 70 kDa FITC-dextran (FD70) across monolayers of T84 CLDN23 KD (shRNA1 and 2) and NS control monolayers ([Dextran]basal). Rate of change of TD4 flux was utilized to calculate the apparent permeability (Papp) of each individual sample. Data are mean ± SD and represent two individual experiments. Each point represents an individual cell monolayer (n = 8 (NS), 6 (shRNA1), and 8 (shRNA2)). **p = 0.0068 (NS vs shRNA1), **p = 0.0015 (NS vs shRNA2); two-tailed Student’s t test. g Left, Cldn23 mRNA expression in Cldn23ERΔIEC or Cldn23f/f IECs. Points represent values from individual mice. Data are mean ± SD and represent two independent experiments, 4 mice per group. ****p ≤ 0001; two-tailed Student’s t test. Right, immunoblotting for CLDN23 and Calnexin (loading control) in colonic IECs from Cldn23ERΔIEC and Cldn23f/f mice. h Confocal images of colonic tissue sections of Cldn23ERΔIEC and Cldn23f/f mice stained for CLDN23 (green) and nuclei (DAPI/blue). Scale bar: 50μm. i Left, schematic of the intestinal loop model used to assess intestinal epithelial permeability to 4 kDa FITC dextran in vivo in Cldn23ERΔIEC and Cldn23f/f mice. Right, CLDN23 depletion resulted in increased intestinal permeability to 4 kDa FITC dextran in vivo. Histograms represent the mean ± SD from three independent experiments. Each point represents an individual mouse (n = 14 (Cldn23f/f) and 16 (Cldn23ERΔIEC)). ****p < 0.0001; two-tailed Student’s t test with Welch’s correction.

