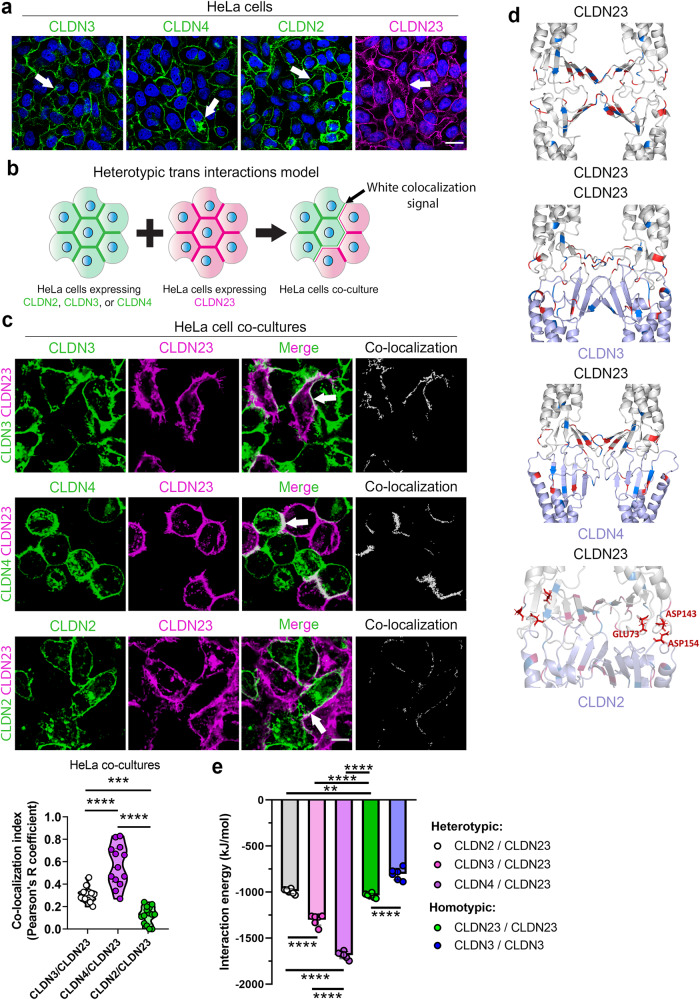
Fig. 5. CLDN23 interacts in trans with CLDN3 and CLDN4, but not CLDN2.
a Immunofluorescence staining and confocal images of HeLa cell monolayers singly expressing CLDN3 (green), CLDN4 (green), CLDN2 (green) or CLDN23 (magenta). Arrows point to homotypic trans interactions at cell-cell contacts. Nuclei were stained with DAPI (blue). Scale bar: 20 µm. b Schematic depicting HeLa cell co-culture model used to analyze heterotypic trans interactions between CLDN23 and either CLDN2, CLDN3, or CLDN4. c Top, immunofluorescence staining and confocal images of HeLa cells expressing either CLDN3 (green), CLDN4 (green), or CLDN2 (green) co-cultured with HeLa cells expressing CLDN23 (magenta). Heterotypic trans interactions were investigated by analyzing the colocalization index from the white signal (arrow) at cell-cell contacts. Scale bar: 20 µm. Bottom, bar graph represents the colocalization analysis, generated by Pearson’s correlation coefficients, between CLDN23 and either CLDN3 (R = 0.31), CLDN4 (R = 0.57), and CLDN2 (R = 0.12) at cell–cell contacts. Data are mean ± SD of three independent experiments. A total of 13 (CLDN3/CLDN23), 14 (CLDN4/CLDN23), and 14 (CLDN2/CLDN23), images per condition were analyzed. ***p ≤ 0.001, ****p ≤ 0.0001; two-tailed Student’s t test. d Claudin tetramer structures showing variable trans interfaces formed by CLDN23/CLDN23, CLDN23/CLDN3, CLDN23/CLDN4, CLDN23/CLDN2 interactions. The secondary structure of CLDNs is shown in ribbon representation with CLDN23 in gray and other CLDNs in light purple. Trans interaction structure shows proximal placement of negatively charged amino acids GLU73 and ASP143 from CLDN23 with ASP154 from CLDN2 are colored in red. e Bar plot showing the total interaction energy between trans interfaces formed by cis dimers of CLDN23 with cis dimers of CLDN2, CLDN3, CLDN4, and CLDN23. Results show the mean ± SD of five independent experiments for each tetramer. Statistical analysis was done with one-way ANOVA with Tukey’s posttest. **p ≤ 0.01; ****p ≤ 0.0001.

