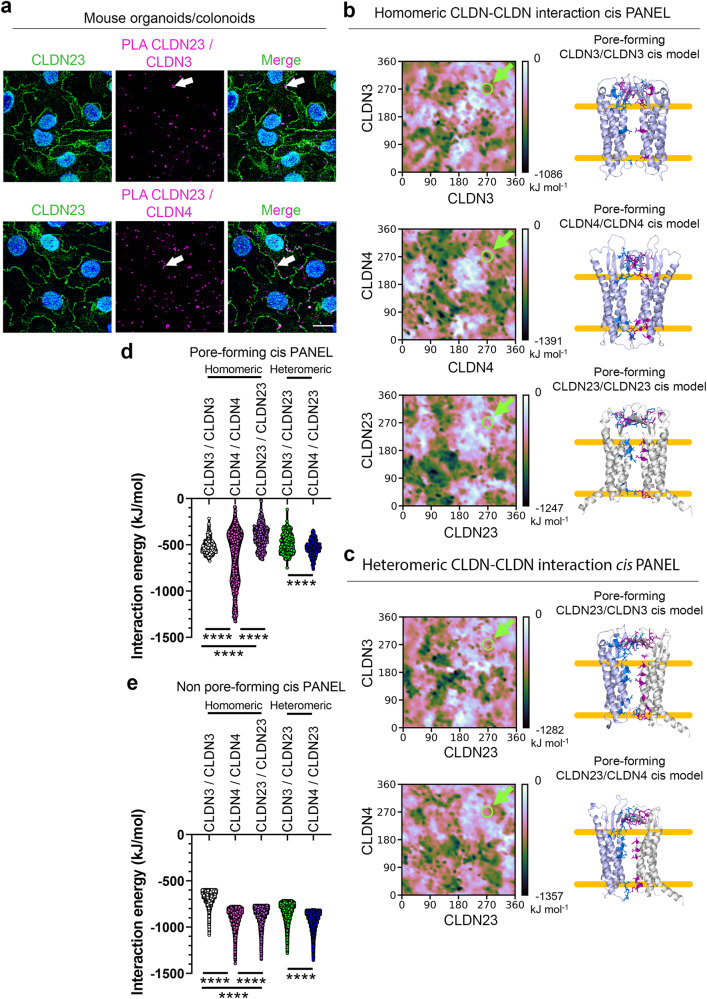
Fig. 6. CLDN23 interacts with CLDN3 and CLDN4 in cis at the cell membrane.
a Left panels, representative confocal images of mouse colonoid monolayers expressing CLDN23 at the plasma membrane. Nuclei stained with DAPI (blue) Middle panels show positive PLA signal (magenta dots) at the cell-cell contact (arrow) between CLDN23 with either CLDN3 or CLDN4 in mouse colonoids. Right panels, show merged images. Scale bars: 20 μm. b, c Left panel, interaction energy landscapes obtained from PANEL method for b homomeric and c heteromeric interactions of CLDN3 and CLDN4 with CLDN23 in which the known pore-forming rotational orientation was indicated at 270° ± 10 for each CLDN (green arrow). Right panel, representative in silico ribbon diagrams of pore-forming homomeric (b) and heteromeric (c) interactions of CLDN3 (light purple), CLDN4 (light purple), and CLDN23 (gray). d Bar plot showing a comparison of energy values of pore-forming homodimers and heterodimers of CLDN3, CLDN4, and CLDN23. Results show the mean ± SD of 400 data points corresponding to the known pore-forming rotational orientation on the landscape. ****p ≤ 0.0001; one-way ANOVA with Tukey’s posttest. e Bar plot showing energy values of non-pore-forming rotational orientations. Results show the mean ± SD of 12,960 data points. ****p ≤ 0.0001; one-way ANOVA with Tukey’s posttest.

