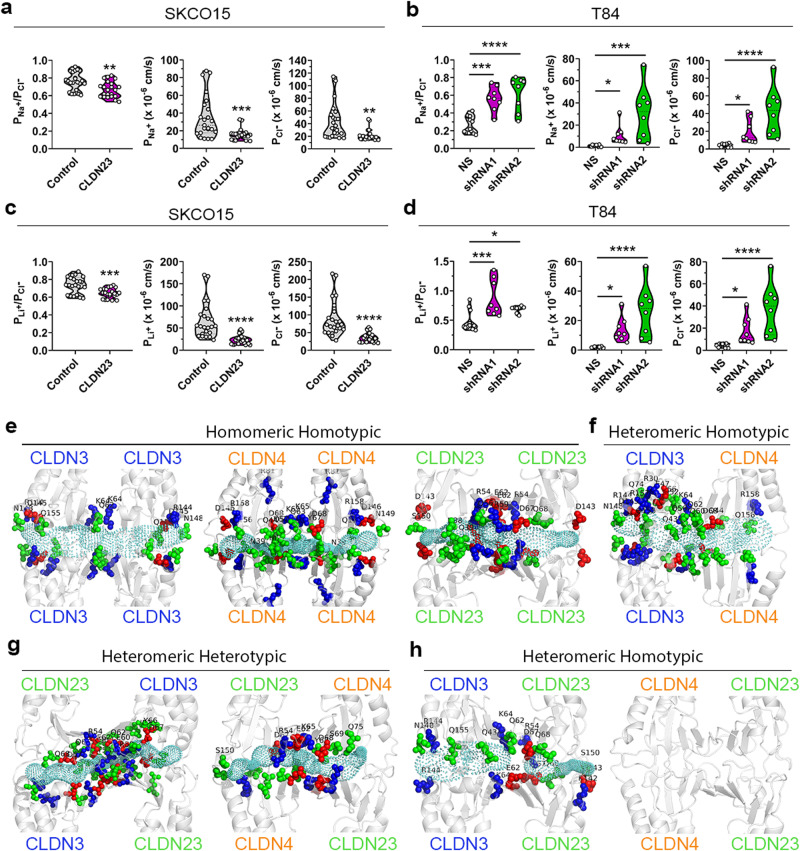
Fig. 8. CLDN23 may decrease the paracellular permeability of ions of either charge by influencing the charge selectivity of CLDN3 and CLDN4 pores.
a, b Charge selectivity (ratio of permeability of PNa+ to Pcl; PNa+/Pcl−) and individual PNa+ and Pcl− in a control and CLDN23 overexpressing SKCO15 cells and in b T84 IECs transduced with two shRNAs against CLDN23 compared with scramble non-silencing shRNA control cells. Data are mean ± SD and represent a four and three b independent experiments. Each dot represents an individual cell monolayer (n = 22 (a) and 11 (b)). *p = 0.0198 (PNa+ of T84 NS vs shRNA1), *p = 0.0173 (PCl− of T84 NS vs shRNA1), **p = 0.0031 (PNa+/Pcl− of SKCO15), **p = 0.0010 (Pcl− of SKCO15) ***p = 0.005 (PNa+ of SKCO15), ***p = 0.0001 (PNa+/Pcl− of T84), ***p = 0.0003 (PNa+ of T84 NS vs shRNA2), ****p ≤ 0.0001 (PCl− of T84 NS vs shRNA2); a two-tailed Student’s t test and b one-way ANOVA with Tukey’s posttest (PNa+/Pcl− of T84) and two-tailed Student’s t test (PNa+ and Pcl− of T84). c, d Charge selectivity (ratio of permeability of PLi+ to Pcl; PLi+/Pcl) and individual PLi+ and Pcl− in c control and CLDN23 overexpressing SKCO15 cells and in d T84 IECs transduced with two shRNAs against CLDN23 compared with scramble non-silencing shRNA control cells. Data are mean ± SD and represent c four and three d individual experiments. Each dot represents an individual cell monolayer (n = 22 (c) and 11 (d)). *p = 0.0454 (PLi+/Pcl− of T84 NS vs shRNA2), *p = 0.0257 (PLi+ of T84 NS vs shRNA1), *p = 0.0211 (PCl− of T84 NS vs shRNA1), ***p = 0.0002 (PLi+/Pcl− of SKCO15), ***p = 0.0002 (PLi+/Pcl− of T84 NS vs shRNA1), ****p ≤ 0.0001 (PLi+ of SKCO15, Pcl− of SKCO15, PLi+ of T84 NS vs shRNA2, and PCl− of T84 NS vs shRNA2); c two-tailed Student’s t test and d one-way ANOVA with Tukey’s posttest. e Homomeric homotypic structures of CLDN3 (blue), CLDN4 (orange), and CLDN23 (green) as well as f heteromeric homotypic CLDN3 and CLDN4. g Heteromeric heterotypic and h heteromeric homotypic trans interaction structures formed by heterodimers of CLDN3 and CLDN4 with CLDN23. The secondary structure of CLDNs is shown in ribbon representation. The pore profile (cyan) represents the available pore for ion/water transport across the tetrameric structure. The positively charged residues are shown in blue, negatively charged residues in red and polar residues (ASN, GLN, SER, THR, TYR) in green.

