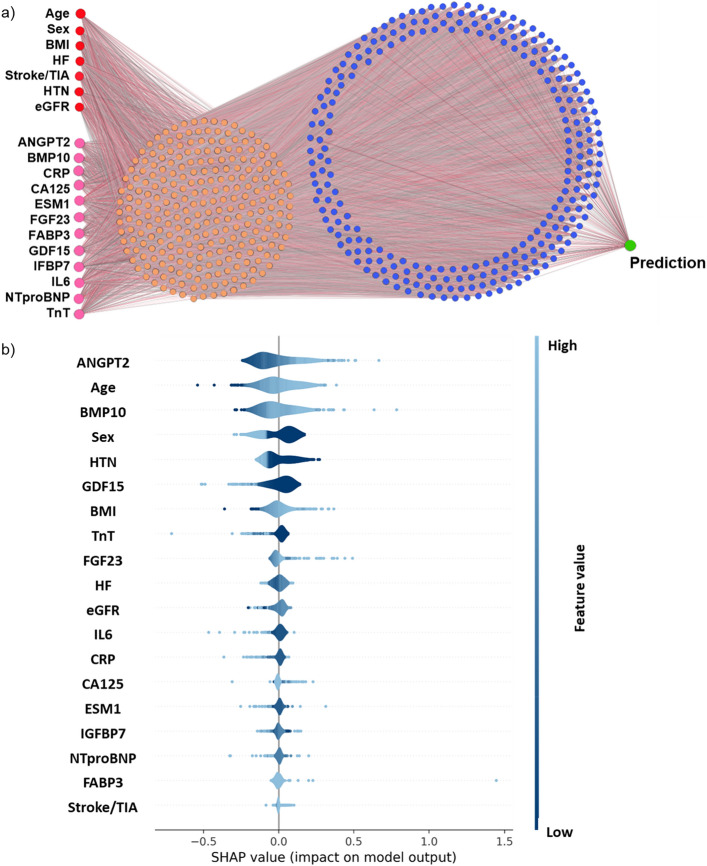
Figure 3.
Neural network analysis confirm regression outcomes. (a) Illustration of the neural network architecture. Red and pink circles are the input variables. In orange and blue are the first and second hidden layer of the network, with increased abstraction. (b) Visualisation of the SHAP procedure using the validation cohort. Variables are ranked top to bottom from the most to least influential. Dark to light shading indicates low to high variable values. Negative and positive SHAP values correspond to tendencies towards sinus rhythm and AF respectively. ANGPT2 angiopoietin 2, BMI body mass index, BMP10 bone morphogenetic protein 10, CRP high-sensitivity C-reactive protein, CA125 cancer antigen 125, eGFR estimated glomerular filtration rate, ESM1 endothelial cell specific molecule 1, FGF23 fibroblast growth factor 23, FABP3 fatty acid binding protein 3, GDF15 growth differentiation factor 15, HF heart failure, HTN hypertension, IGFBP7 insulin like growth factor binding protein 7, IL6 interleukin 6, NTproBNP N-terminal pro-B-type natriuretic peptide, SHAP Shapley additive explanations, TIA transient ischemic attack, TnT high-sensitivity cardiac troponin T.

