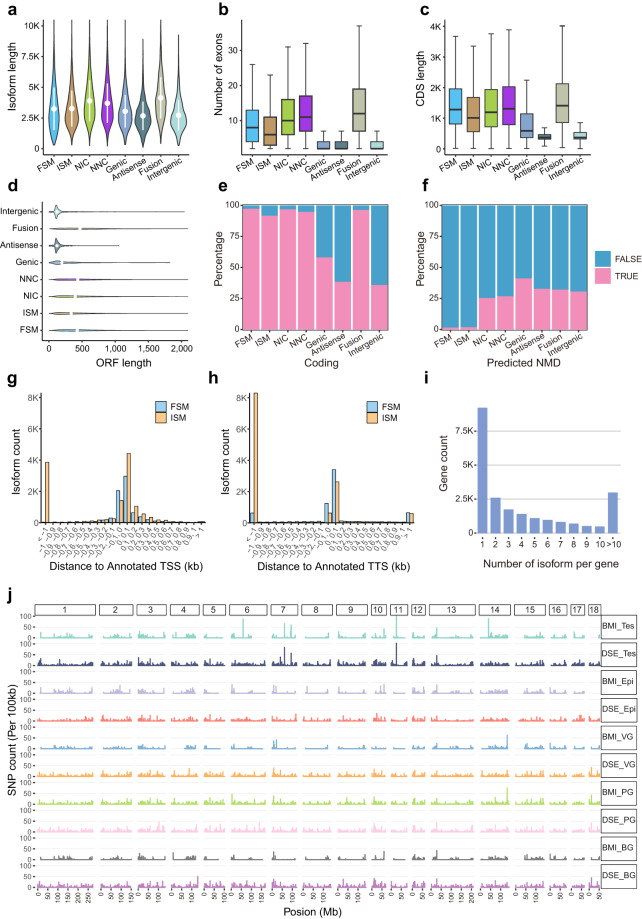
Fig. 4.
Characteristics of identified isoforms. Plots showing the length of isoforms (a), the number of exons (b), the length of coding sequence (c), the length of ORF (d), the proportion of protein-coding genes(e), and the proportion of predicted NMD (f) in known isoforms (FSM, ISM) and novel isoforms (NIC, NNC, Genic, Antisense, Fusion, Intergenic). Histogram showing the distance to annotated transcription start site (TSS) (g) and transcription termination site (TTS) (h) for FSM and ISM. (i) Number of isoforms per gene. (j) Single-nucleotide polymorphism (SNP) count using 100 kb of sequencing length as window size in the ten samples. Note: NMD, nonsense-mediated mRNA decay; FSM, full splice match; ISM, incomplete splice match; NIC, novel in catalog; NNC, novel not in catalog. Tes, testis; Epi, epididymis; VG, vesicular gland; PG, prostate gland; BG, bulbourethral gland.

