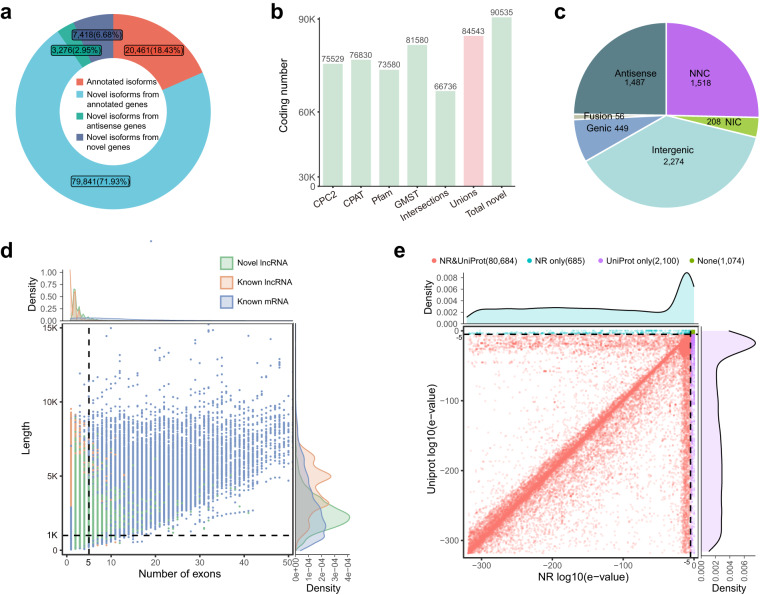
Fig. 5.
Analysis of novel coding isoforms and novel non-coding isoforms. (a) Percentage of isoforms in each annotation category. (b) Number of coding isoforms predicted by four approaches: CPC2, CPAT, GMST and Pfam. The pink bar indicates the union of predicted coding isoform from four approaches. (c) The number of lncRNA in each category. (d) The scatter plot shows the number of exons (x axis) and length distribution (y axis) of novel lncRNA, known lncRNA and known mRNA. Green dot: novel lncRNA; Orange dot: known lncRNA; Blue-gray: known mRNA. The vertical dashed line represents the 5 exons. The horizontal dashed line represents the 1 kb transcript length (e) Sequence annotation analysis for novel coding isoforms. The red points represent significance (log10(e-value) <−5) according to both NR (Non-Redundant protein sequence database) and Uniprot (Universal protein database). Blue points indicate NR only, purple points indicate UniProt only, and green points indicate no significance in either analysis.

