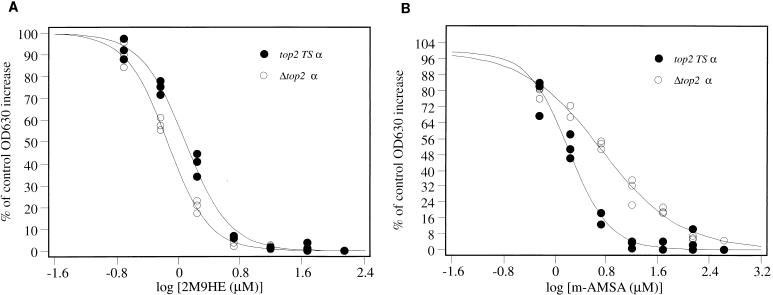
FIG. 3.
Dose-response curves of Δtop2 α and top2(Ts) α challenged with 2M9HE (A) and m-AMSA (B). Microplate wells were seeded as described in Materials and Methods, with one plate for each yeast strain. All experiments were carried out in triplicate. ID50s were obtained by calculation of the antilog of the x-axis value at the inflection point of each sigmoid-curve fit.

