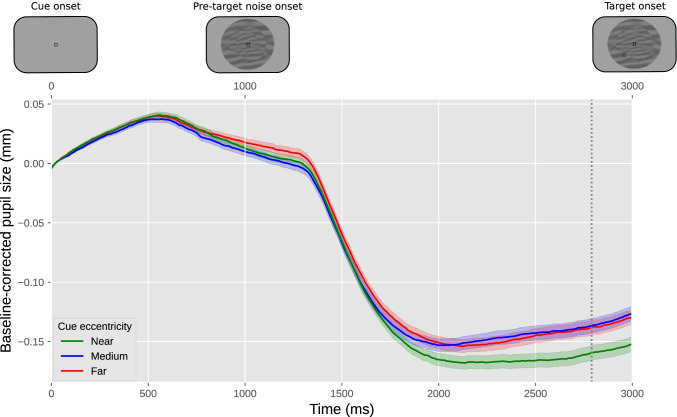
Fig. 12.
Results from our example experiment. The y-axis represents baseline-corrected pupil size. The lower x-axis represents time in milliseconds since cue onset. The upper x-axis represents the order of the events in the experiment. Differently colored lines represent the three cue eccentricities (far, medium, near). Error bands indicate grand standard error. The vertical line indicates the mean of the samples at which the effect of cue eccentricity was tested

