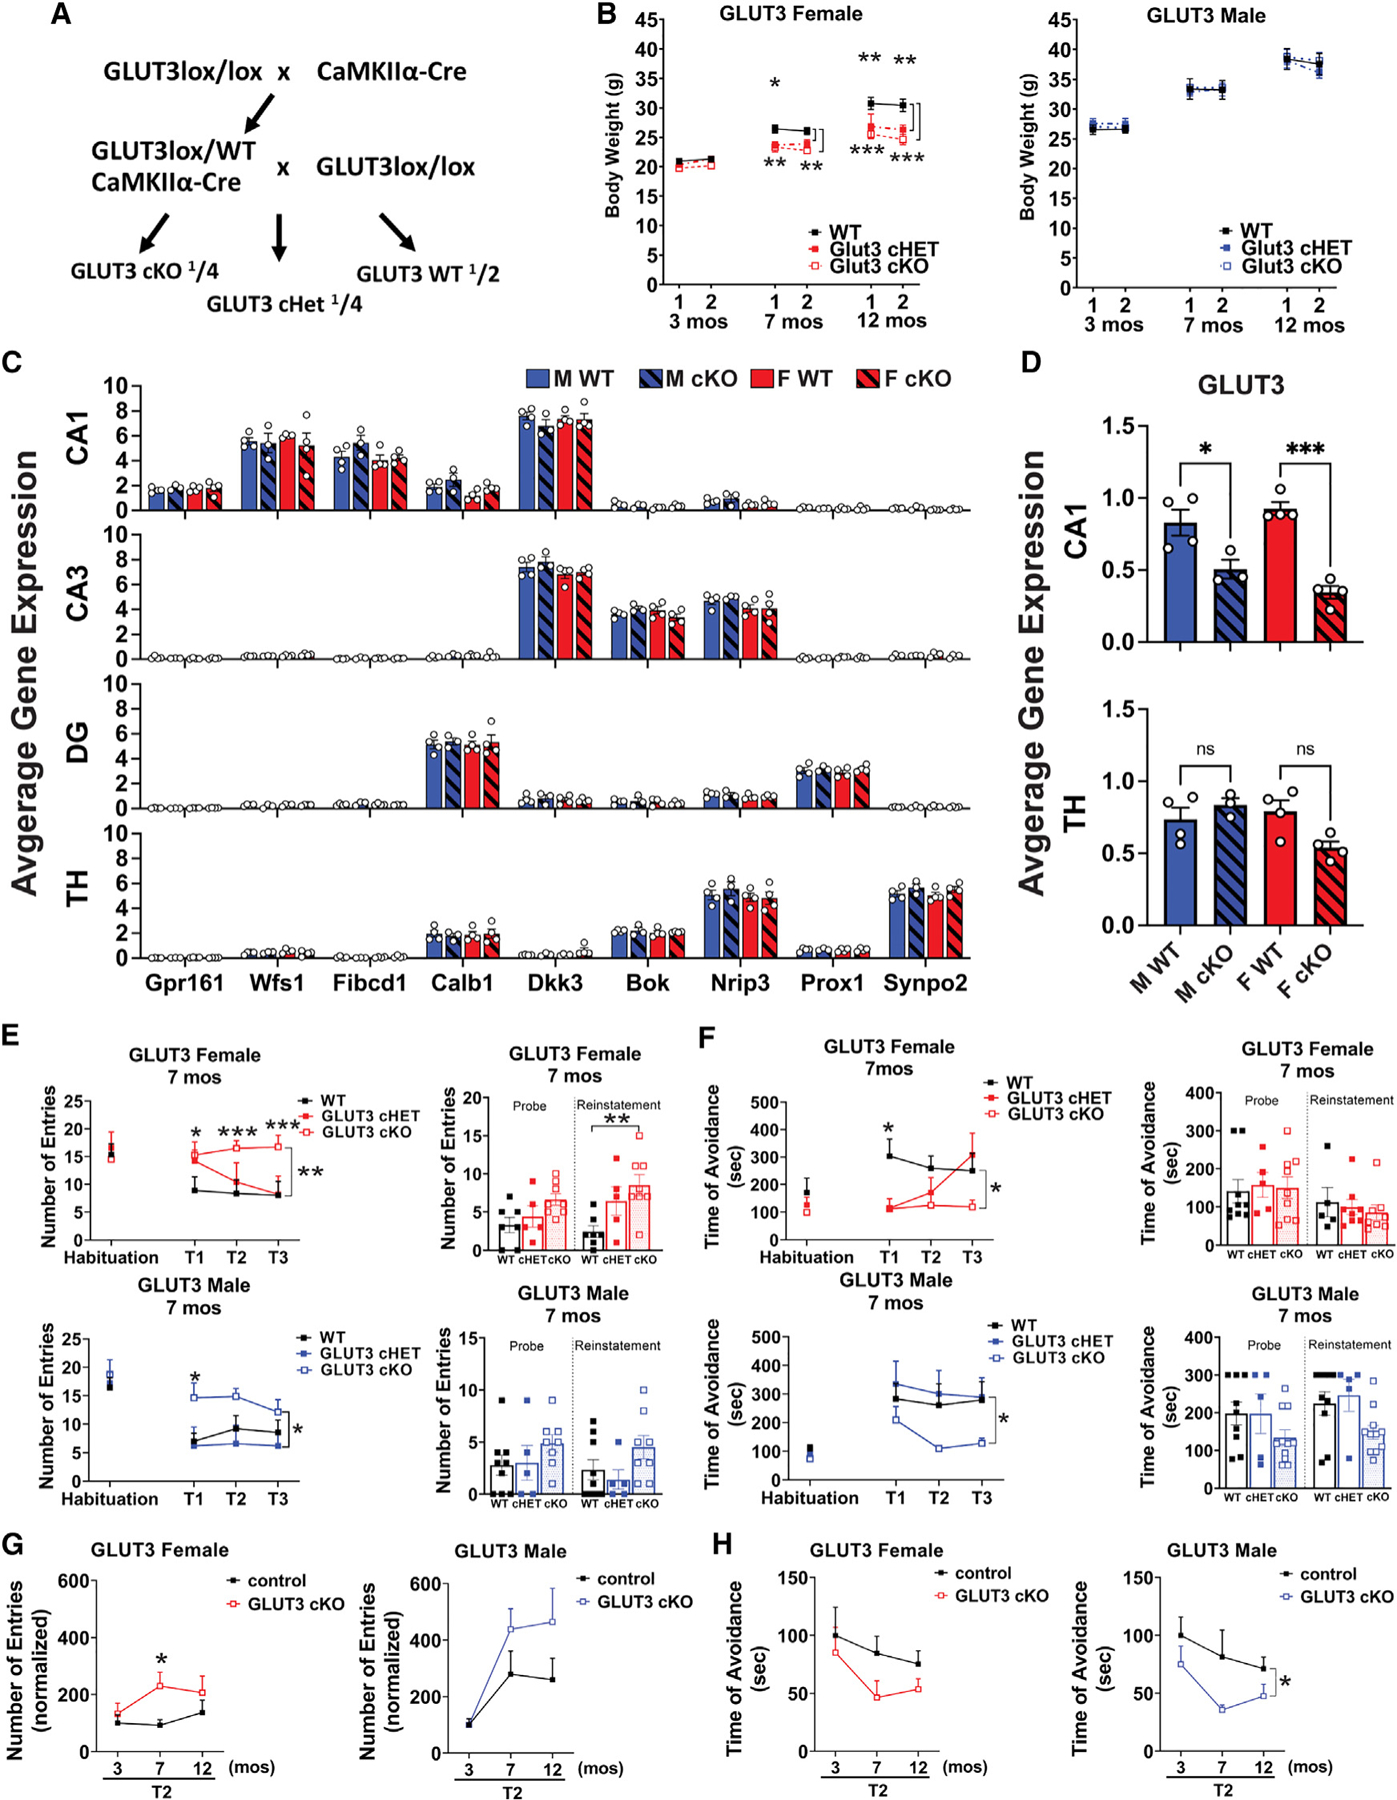
Figure 2. Neurons have an age-dependent requirement for neuronal glucose uptake in vivo.

(A) Breeding scheme for GLUT3cKO mice.
(B) Weight measurements at age 3, 7, and 12 months. Data are means ± SEM; n = 9 GLUT3 WT, 5 Het, and 8 KO females, and n = 8–9 WT, 5 Het, and 8 KO males at each time point.
(C) Graphs show regional signatures unique to neurons in CA1 (20–36 capture areas/mouse), CA3 (11–30 capture areas/mouse), dentate gyrus (DG; 13–34 capture areas/mouse), and thalamus (TH; 65–170 capture areas/mouse). n = 3–4 mice/group.
(D) GLUT3 expression in CA1 and thalamic neurons. n = 3–4 mice/group.
(E and F) GLUT3cKO mice develop age-dependent spatial learning and memory deficits as shown by active place avoidance. At 7 months, GLUT3cKO female and male mice have increased entrances into the aversive zone (E) and decreased maximal time of avoidance of this zone (F).
(G and H) Longitudinal analysis shows change in second time point (T2) of active place avoidance, with each mouse normalized to the mean control value at 3 months. Although GLUT3cKO mice are equivalent to controls at 3 months, 7- and 12-month-old GLUT3cKO mice of both sexes enter the aversive zone more frequently than controls (G; see Figure S2 for full data from 3 and 12 months) and avoid it for less time (H). n = 9 WT, 5 Het, 8 KO females, and n=8–9 WT, 5 Het and 8 KO males at each time point, compiled from three cohorts.
ns, not significant.
*p % 0.05; **p < 0.01; ***p < 0.001 by Welch ANOVA with Dunnett’s T3 multiple comparisons test (B, E, F), two-way ANOVA with Tukey’s multiple comparison test (C), one-way ANOVA with Sidak’s multiple comparison test (D), and Welch’s t test (G and H). Brackets in graphs (E–H) show significance of linear mixed modeling for genotype (E and F) or the interaction of genotype and age (H).
