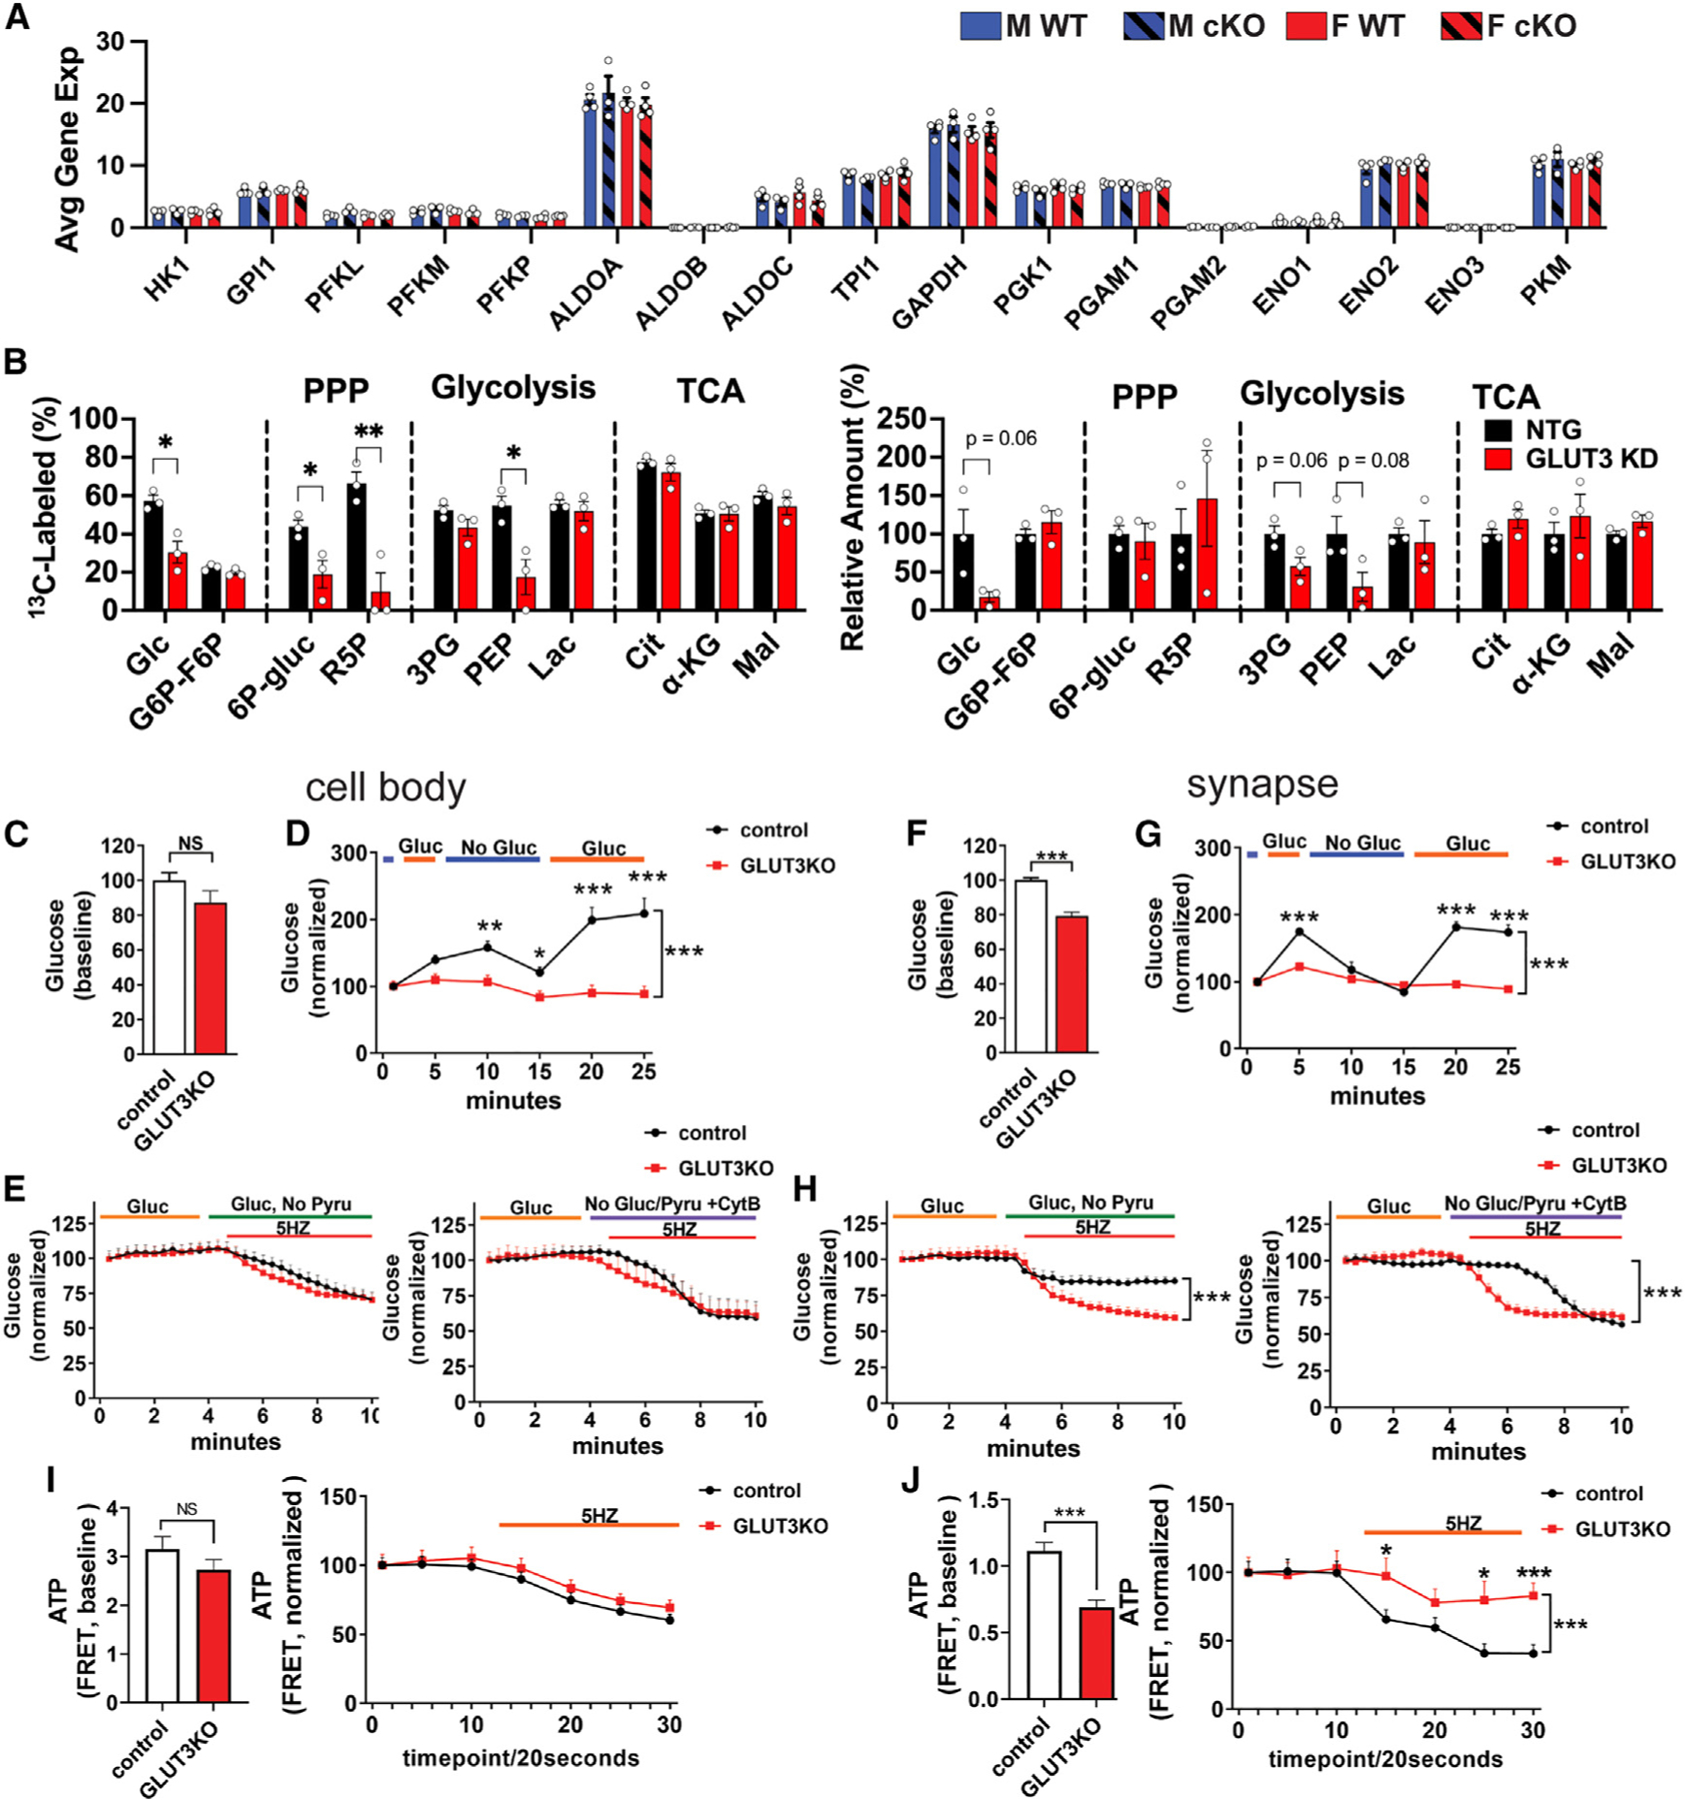
Figure 6. Neurons require glucose uptake and glycolysis to maintain ATP at the synapse.

(A) Expression of glycolytic genes in GLUT3cKO CA1 neurons. Data are means ± SEM. n = 3–4 mice/group, compiled from 20 to 36 capture areas/mouse in CA1.
(B) Effect of GLUT3 KD in iPSC-derived neurons incubated for 24 h with 1.5 mM [U-13C]glucose on percentage of glucose-derived metabolites and total metabolites. The corresponding isotopologue data are shown in Figure S7C. Identical NTG controls (1.5 mM [U-13C]glucose) are shown in Figures S7B and S7C. n = 3 samples/group.
(C–H) GLUT3 KO disrupts glucose homeostasis in individual neurons. GLUT3lox/lox neurons were co-transfected with a fluorescent glucose sensor (iGlucoSnFR-mRuby) and either Cre (to delete GLUT3, GLUT3KO) or empty vector (control), as well as BFP-synaptophysin to identify synaptic boutons.
(C and D) GLUT3KO neurons had similar basal glucose levels to controls at the cell body (C), but their glucose levels were less responsive to changes in the extracellular glucose (D).
(E) Glucose levels decreased similarly in GLUT3KO and control neurons with electrical stimulation (5 Hz, 5.5 min) to increase neural activity (left), and the speed and extent of decrease was somewhat greater when glucose uptake was blocked with cytochalasin B (right) n = 8–10 coverslips/group (two or three cells/coverslip) from three independent experiments.
(D and E) Control and GLUT3cKO glucose values are normalized to the starting point.
(F and G) The synapses of GLUT3KO neurons had lower basal glucose levels (F), and their glucose levels were less responsive to changes in the extracellular glucose than controls (G).
(H) Glucose levels in GLUT3KO synapses decreased to a greater extent in GLUT3cKO versus control synapses, in response to electrical stimulation (left). Blocking all glucose uptake with cytochalasin B caused glucose levels in controls to drop to GLUT3KO levels (right). n = 8–10 coverslip/group, three to five synapses/coverslip from three independent experiments.
(I) GLUT3KO neurons have similar basal ATP levels at cell bodies (left), and in response to electrical stimulation (5 Hz, 5.5 min) to increase the ATP demand (right). n = 11–13 coverslips/group, two or three cells/coverslip from five independent experiments.
(J) GLUT3KO synaptic boutons have decreased ATP levels (left), and their ATP levels decrease less in response to stimulation (5 Hz, 5.5 min). n = 6–7 coverslips/group, three to five synapses/coverslip from three independent experiments.
ns, not significant; *p < 0.05; **p < 0.01; ***p < 0.001, by unpaired t tests (C, F, I, J) or two-way ANOVA with Tukey’s multiple comparison (A and B). Brackets in graphs show significance of linear mixed modeling for the interaction of genotype and time (D, E, G, H, I right, J right) with Sidak’s multiple comparison.
