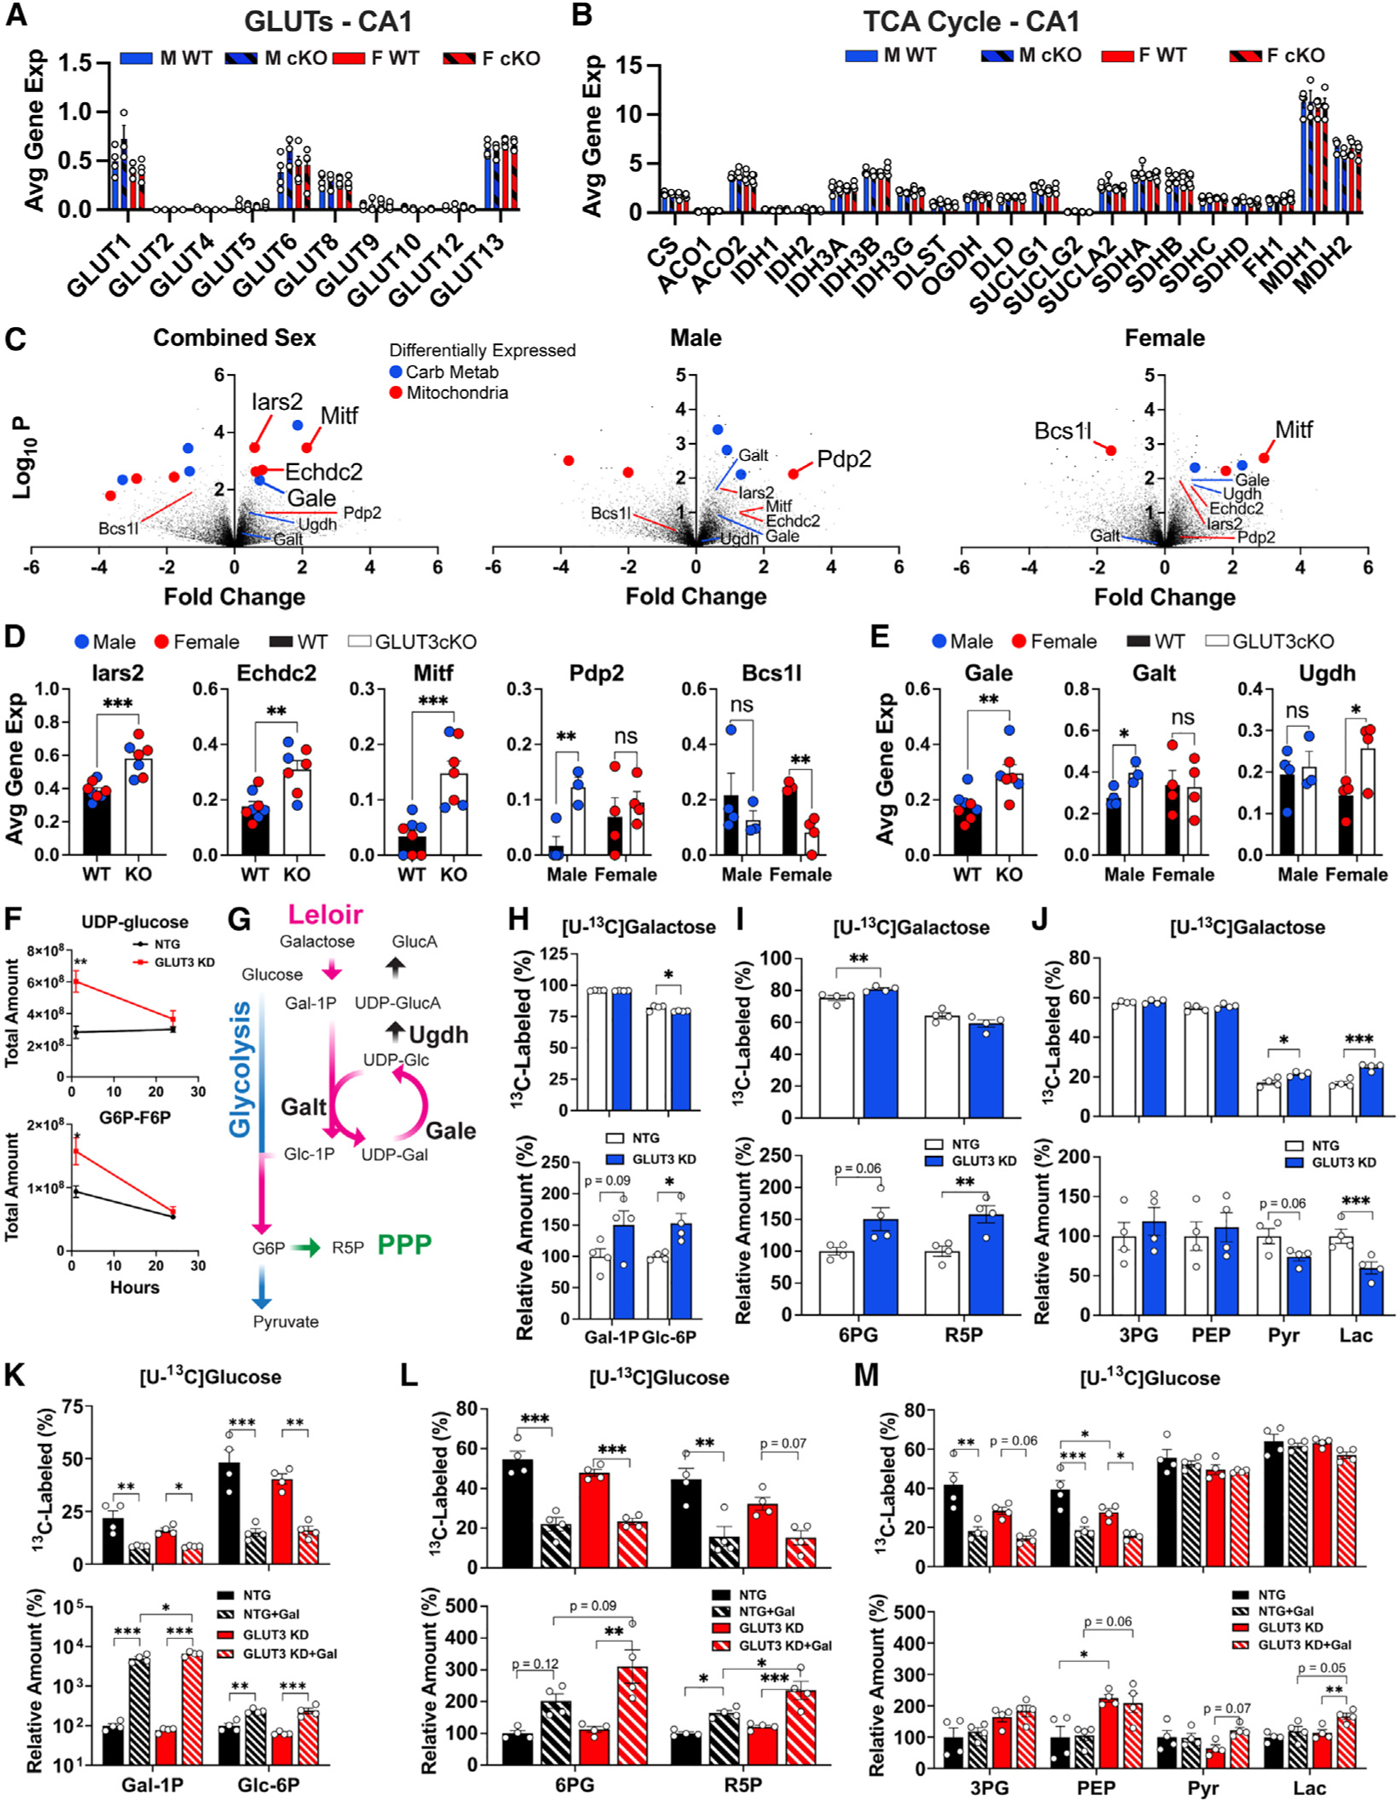
Figure 7. Sex-dependent and independent neuronal responses to decreased glucose uptake.

(A) Impact of GLUT3cKO on expression of other GLUTs in CA1 neurons. Data are means ± SEM, n = 3–4 mice/group, each compiled from 20 to 36 capture areas in CA1 per mouse.
(B) Expression of TCA genes in CA1 neurons. n = 3–4 mice/group.
(C) Volcano plots of differentially expressed genes between GLUT3cKO and WT mice. n = 7–8 (combined sexes), three or four (males only) and four (females only) mice/group. Blue and red points indicate genes related to carbohydrate metabolism and mitochondria, respectively.
(D) Gene expression of top hits Iars2, Echdc2, Mitf, Pdp2, and Bcs1l for CA1 neurons. n = 3–4 mice/group. Data points are shown for male (blue) and female (red) mice.
(E) Expression of galactose metabolism hits Gale, Galt, and Ugdh for CA1 neurons. n = 3–4 mice/group. Data points for male (blue) and female (red) mice.
(F) Impact of GLUT3 KD on targeted and untargeted metabolite levels of UDP-glucose and G6P-F6P following incubation with [U-13C]glucose for 1 and 24 h n = 3 samples/group/time point.
(G) Schema of potential compensatory pathway for decreased glucose uptake, by which galactose is metabolized into glucose-6-phosphate.
(H–J) Relative amounts and [U-13C]galactose fractional labeling of Leloir, PPP, and glycolytic metabolites in GLUT3 KD and NTG neurons after 24 h of culture. n = 4 samples/group.
(K–M) Relative total amounts and [U-13C]glucose fractional labeling of Leloir, PPP, and glycolytic pathway metabolites in GLUT3 KD neurons relative to NTG neurons when treated with either 1.5 mM [U-13C]glucose or 1.5:1.5 mM [U-13C]glucose:galactose for 24 h. n = 4 samples/group.
*p < 0.05, **p < 0.01, ***p < 0.001 by unpaired t test and two-way ANOVA with either Tukey’s multiple comparisons test (D, E, H–M) or Sidak’s multiple comparisons test (F).
