
Fig. 1.
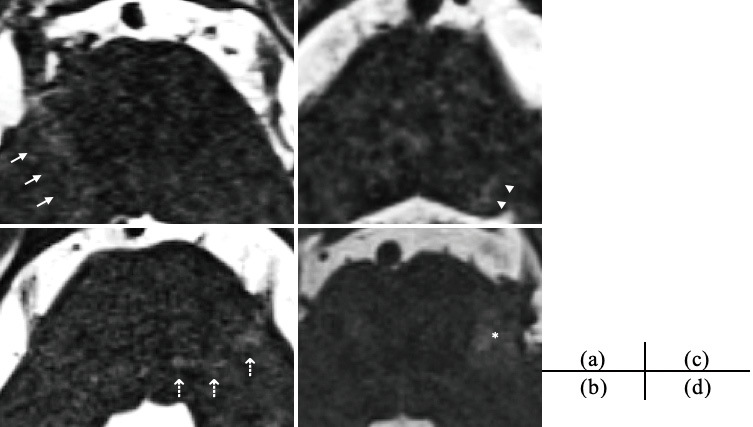
Positive findings of T2 high-intensity lesions along the affected trigeminal pontine pathway with MRI using 3D T2 sampling perfection with application-optimized contrast using different flip angle evolution (SPACE) sequences.
(a) Extensive hyperintense area along the affected trigeminal pontine pathway on the right side, (b) Extensive hyperintense area toward the principal sensory nucleus of the trigeminal nerve on the left side, (c) Extensive hyperintense area toward the trigeminal spinal subnucleus on the left side, (d) Extensive hyperintense area over the trigeminal nerve in the brainstem region on the left side. The white arrows show hyperintense areas along the affected trigeminal pontine pathway, the white dotted arrows show the principal sensory nucleus of the trigeminal nerve, the white arrowhead shows the trigeminal spinal subnucleus, and the asterisk shows the hyperintense area over the trigeminal nerve.