
Figure 2.
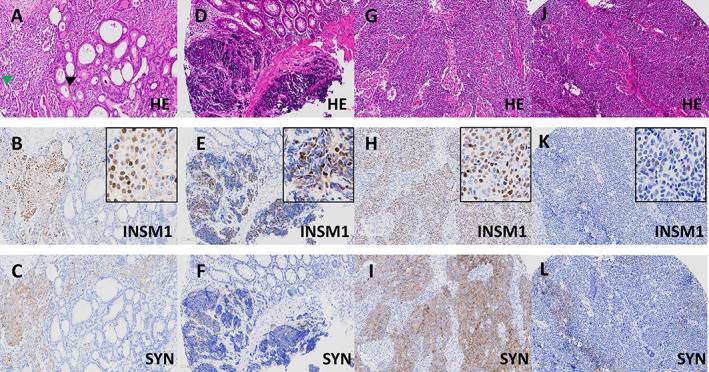
INSM1 expression groups in colorectal MANEC and NEC. (A–C) Colorectal MANEC (A, H&E, ×20) consisting of an adenocarcinoma NOS (black arrow) intermingled with a large cell NEC (green arrow), which shows diffuse expression of synaptophysin (C, ×20). The NEC shows a substantial number of positive cells (60%) with variable staining intensities with some showing strong nuclear staining (B, ×20, inset ×40), resulting in an IRS of 9 (INSM1 high). The adenocarcinoma component is INSM1 negative. (D–F) Colorectal small cell NEC (D, H&E, ×20) showing weak to moderate expression of synaptophysin (F, ×20). The NEC shows a substantial number of positive cells (55%) with variable staining intensities ranging from very weak to strong (E, ×20, inset ×40), resulting in an IRS of 9 (INSM1 high). (G–I) Colorectal large cell NEC (G, H&E, ×20) with diffuse expression of synaptophysin (I, ×20) and diffuse and strong (90%) expression of INSM1 (H, ×20, inset ×40), resulting in an IRS of 12 (INSM1 high). (J–L) Colorectal large cell NEC (J, H&E, ×20) with patchy expression of synaptophysin (I, ×20) and scattered (10%) expression of INSM1, with most positive nuclei showing weak but some showing moderate staining intensity (K, ×20, inset ×40), resulting in an IRS of 4 (INSM1 moderate).