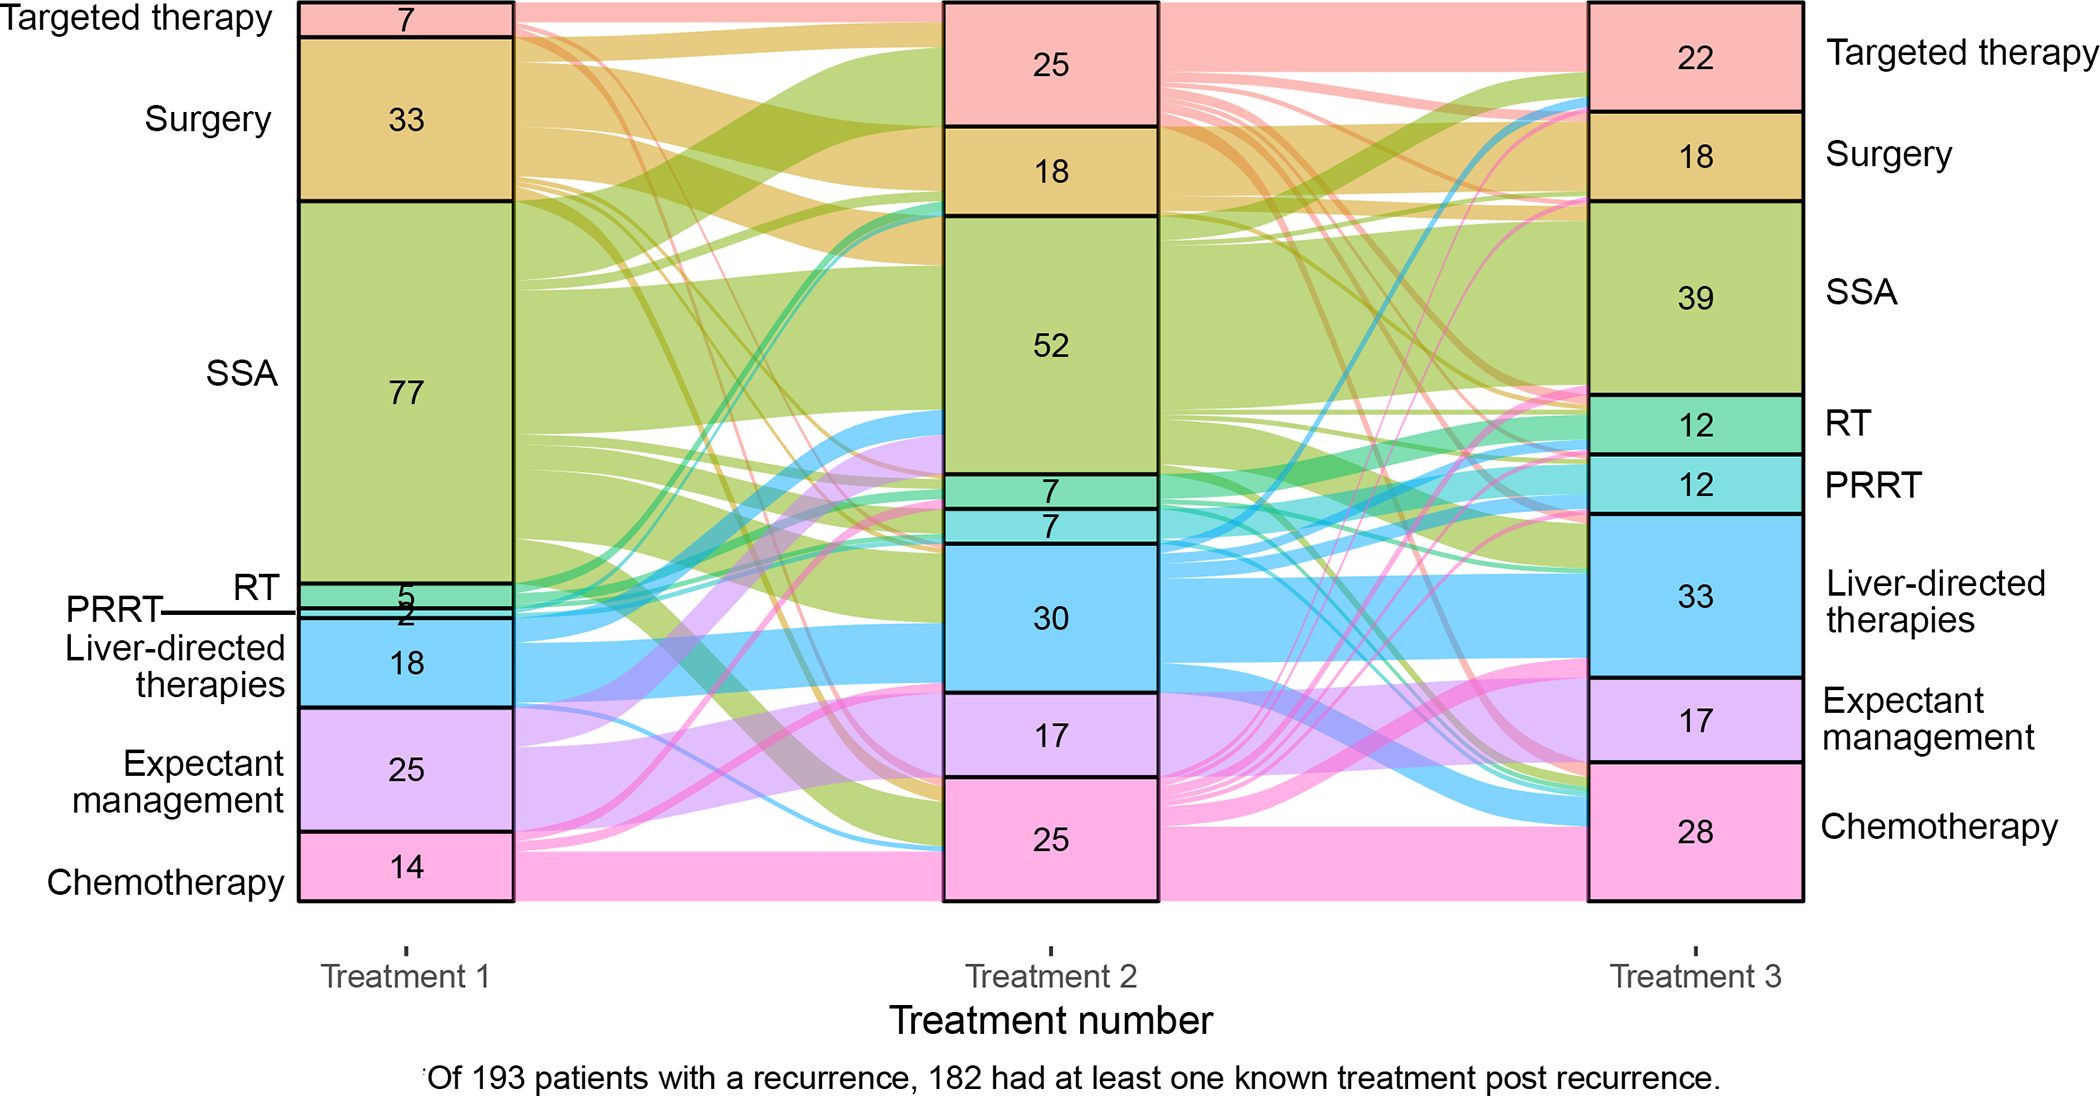
Figure 3.

Sequence of first three treatments following first recurrence represented by Sankey diagram. The columns display the number of patients who underwent different treatments at different time-points. The arcs linking the columns represent the patients shifting from one treatment to another. The width of each arc is proportional to the number of patients.
