FIGURE 10.
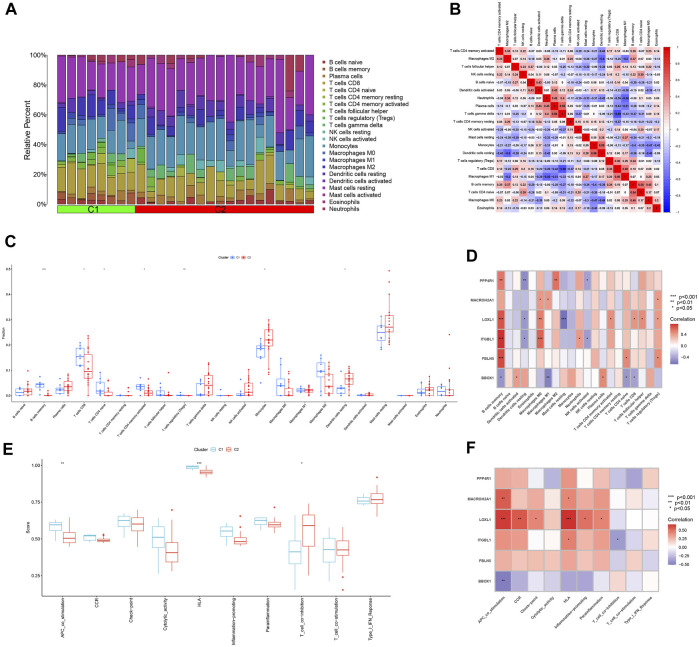
Analysis of immune infiltration between different subtypes. (A) Bar graph of the relative proportions of 22 immune cells between the two subtypes C1 and C2. (B) Heat map of the correlation between 22 immune cells. (C) Box line plot of expression differences of immune cells between two subtypes of C1 and C2. (D) Heat map of correlation between feature genes and 22 immune cells. (E) Box line plot of expression differences between C1 and C2 subtypes for 10 immune functions. (F) Heat map of the correlation between the feature genes and 10 immune functions. *p < 0.05, **p < 0.01, ***p < 0.001.

