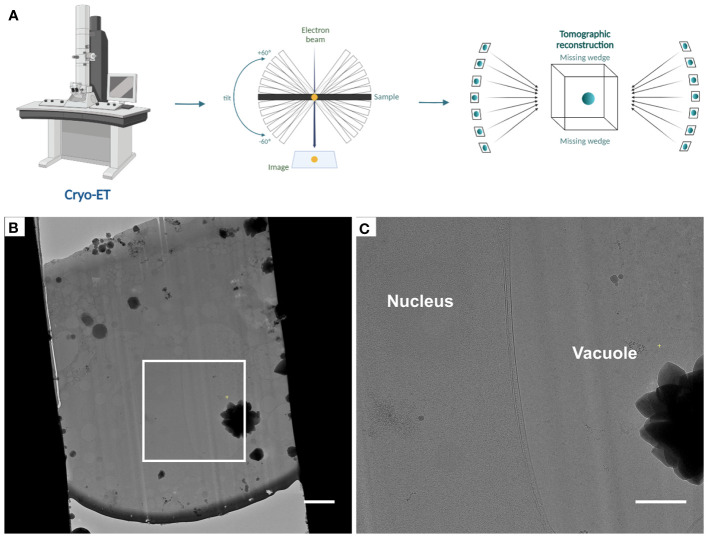
Figure 4.
Automated tomogram acquisition and tomogram reconstruction (Steps 57 - 64) (A), Diagram representing the steps of tomogram acquisition and tomogram reconstruction. (B), Cryo-TEM overview of lamellae after fine milling to a thickness of ~ 180 - 200 nm, the white box indicates the area shown in (C). (C), Higher magnification cryo-TEM overview. Scale bars: 2 µm (B) and 1 µm (C).

