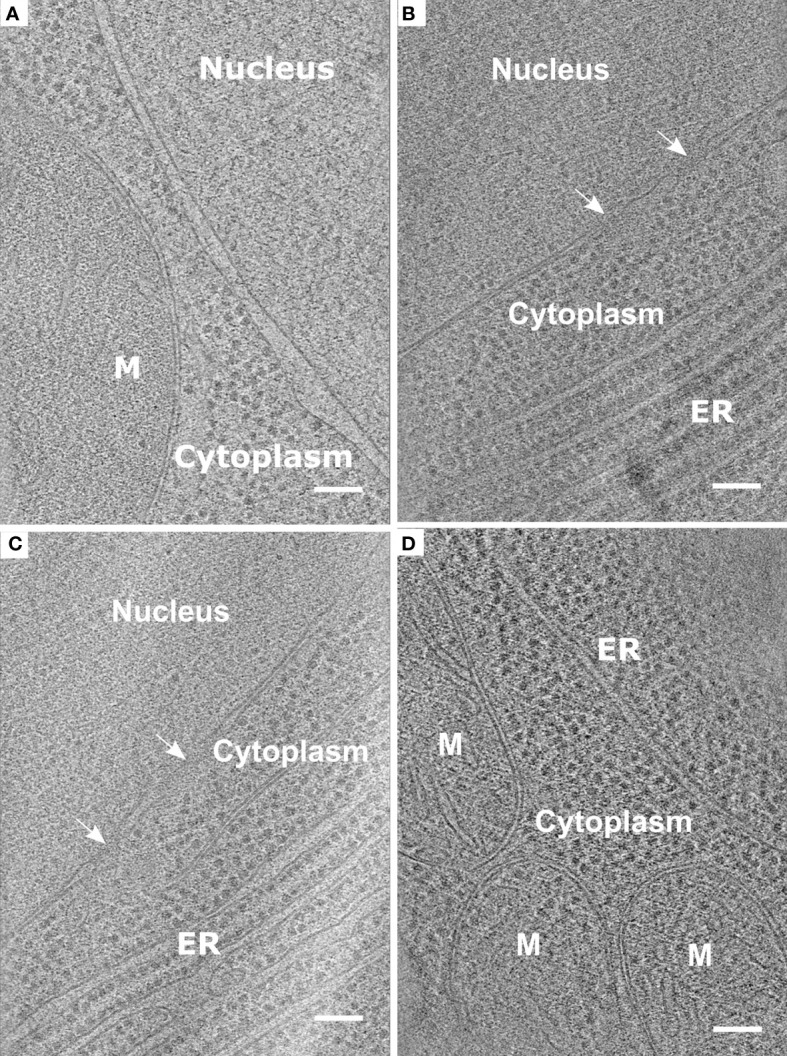
Figure 5.

Representative data obtained from the protocol described using root protoplasts from Arabidopsis thaliana. (A-D). Slices through tomograms taken from vitrified and milled root protoplasts (lamella thickness: ~ 200 nm or less). Slices through the tomograms show mitochondria (M), Endoplasmic reticulum (ER), and Nuclear Pore Complexes (white arrows). Scale bars: 100 nm (A–D).
