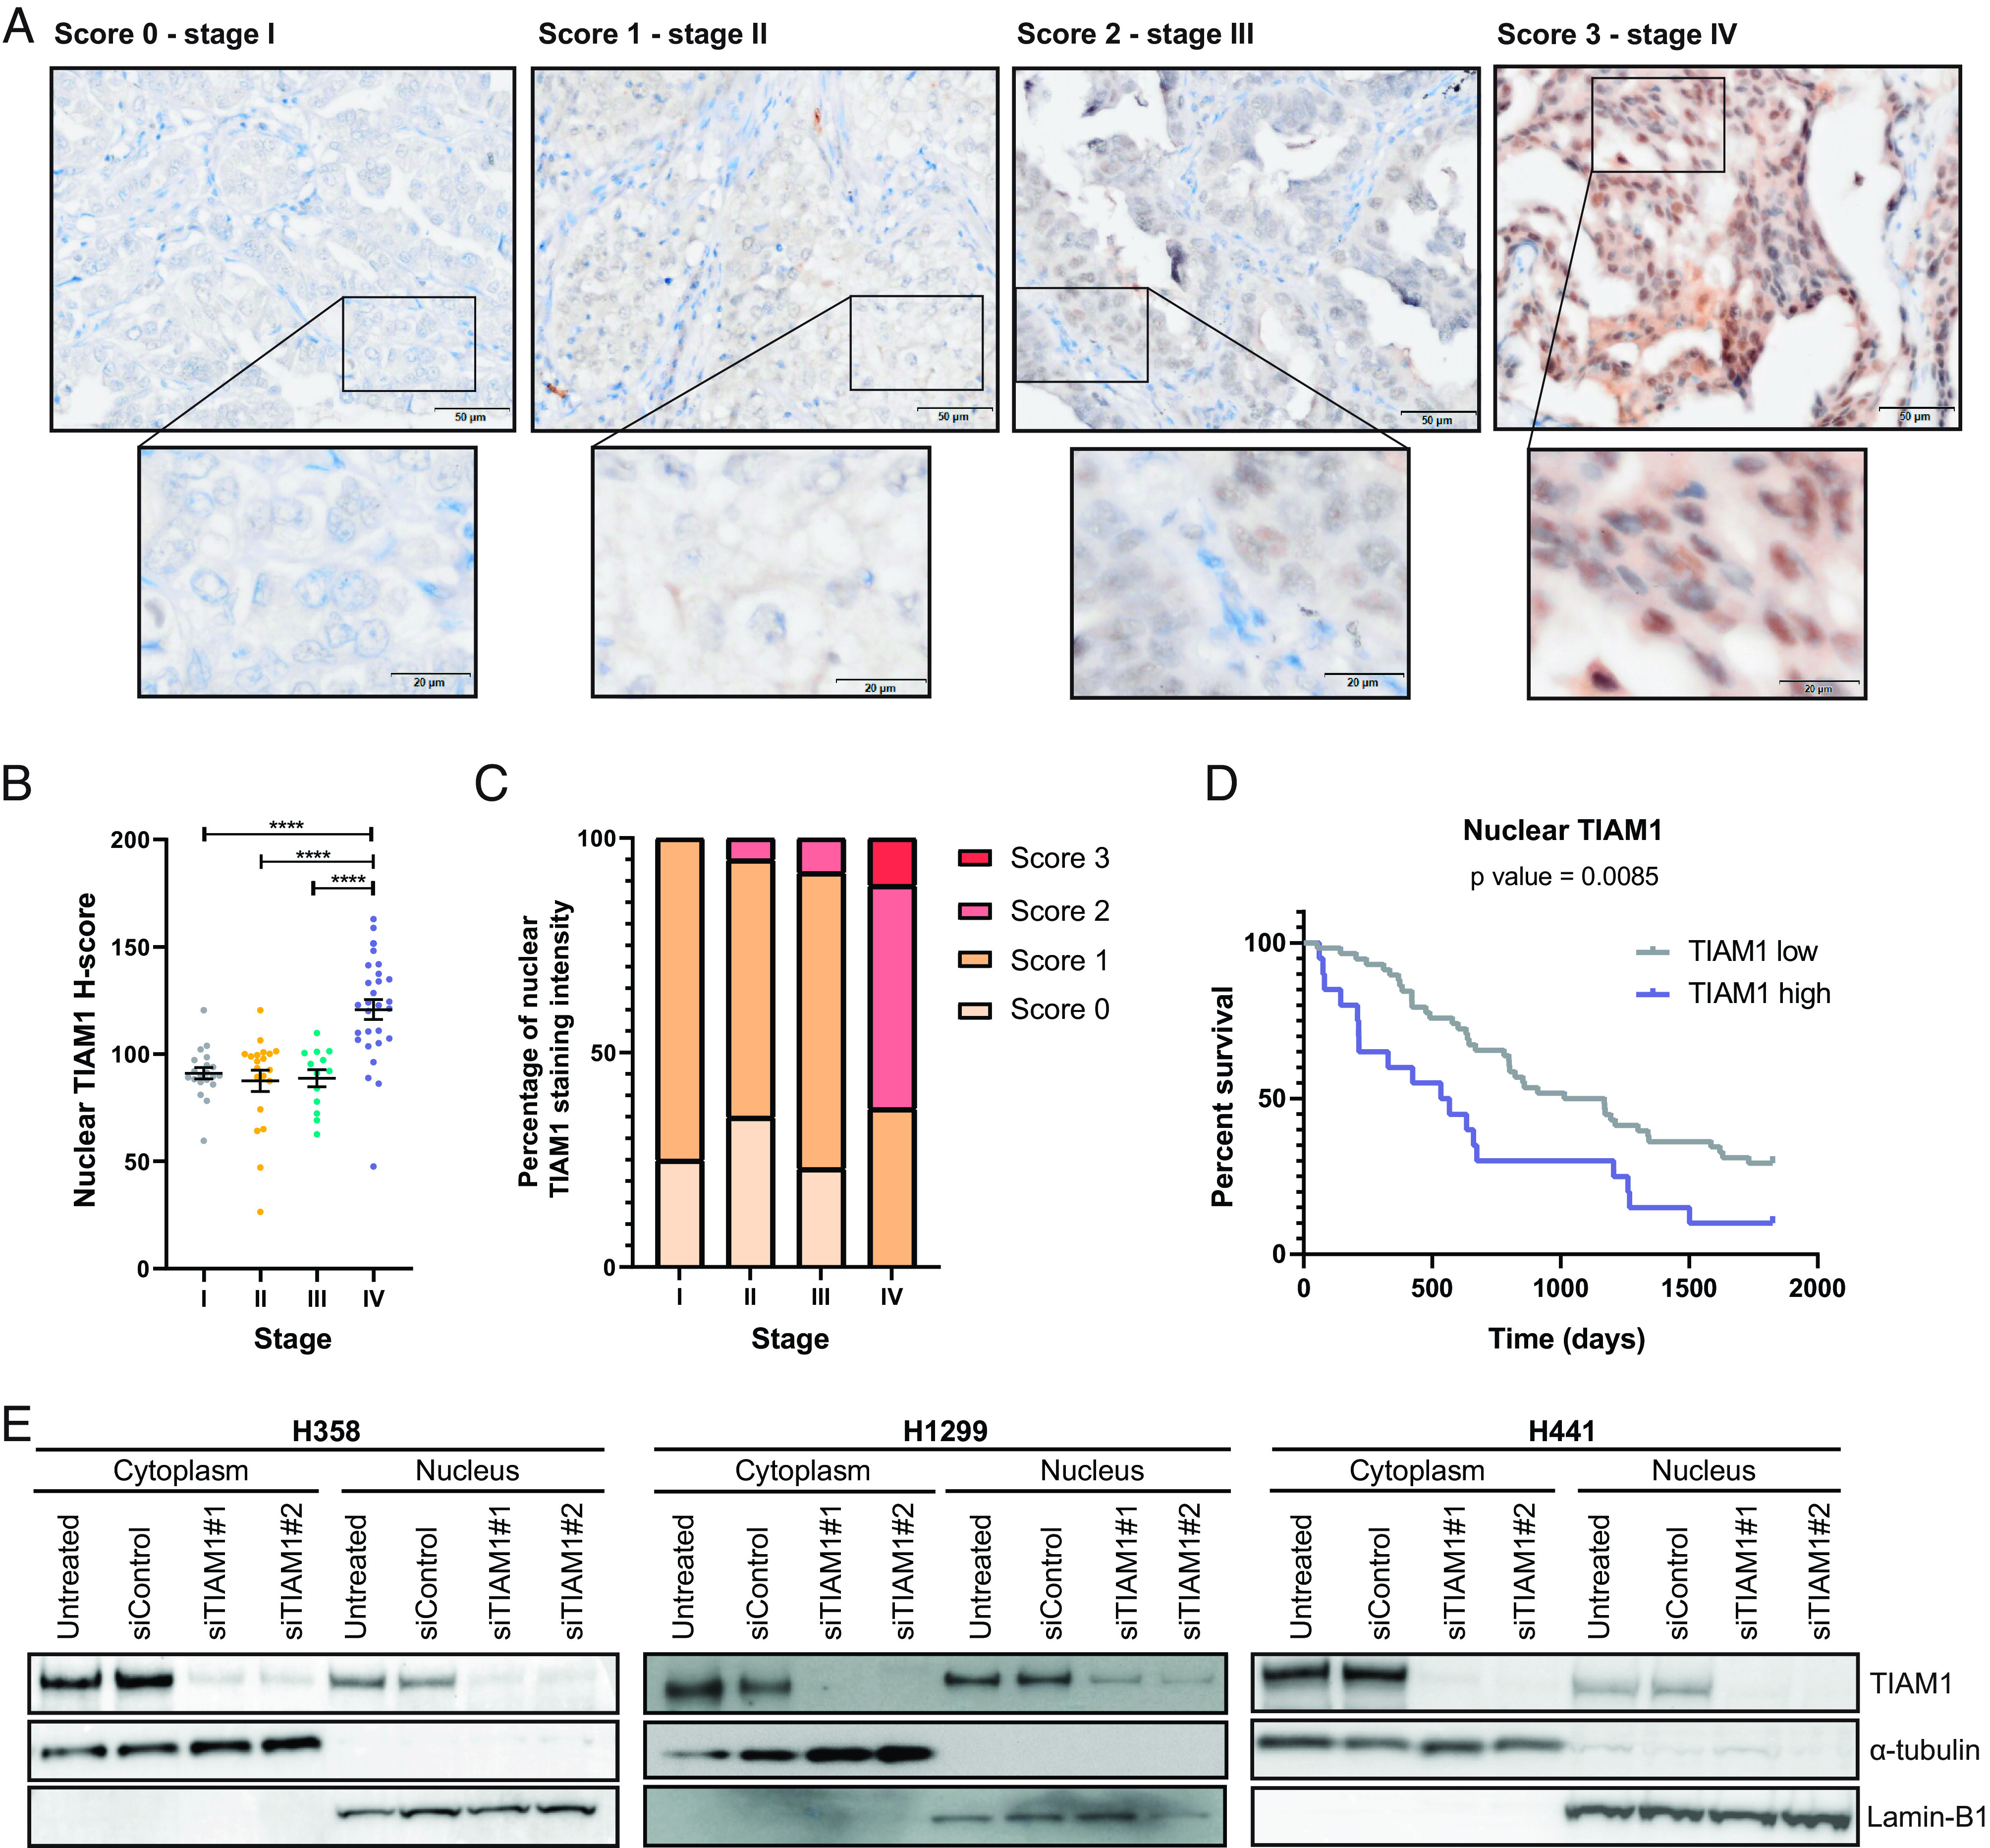
Fig. 1.

Abundance of nuclear TIAM1 correlates with NSCLC progression. (A) Representative examples of strong (score 3), moderate (score 2), weak (score 1), and negative (score 0) immunohistochemical staining of TIAM1 expression in a panel of LUAD tumors from stage I-IV patients. (Scale bars, 50 μm and 20 μm.) (B and C) Quantification of nuclear TIAM1 staining intensity from samples as in (A), using HALO AI image analysis software to calculate TIAM1 H-score per patient (B) or histopathologist analysis of the percentage of overall TIAM1 staining score (0 to 3) per patient (C) per stage. Stage I, n = 20; stage II, n = 20; stage III, n = 13, and stage IV, n = 28 patients. (D) Kaplan–Meier plot comparing the 5-y survival of patients with the highest quartile of nuclear TIAM1 expression vs. the other three quartiles (the P value shown is for the Mantel–Cox test). (E) Western blot analysis of TIAM1 protein levels in the cytoplasmic and nuclear fractions of H358, H1299, and H441 cells that were untreated or transfected with TIAM1 or control siRNAs, as indicated. Lamin B1 and α-tubulin were used as nuclear and cytoplasmic loading controls, respectively. ****P < 0.0001 (ANOVA).
