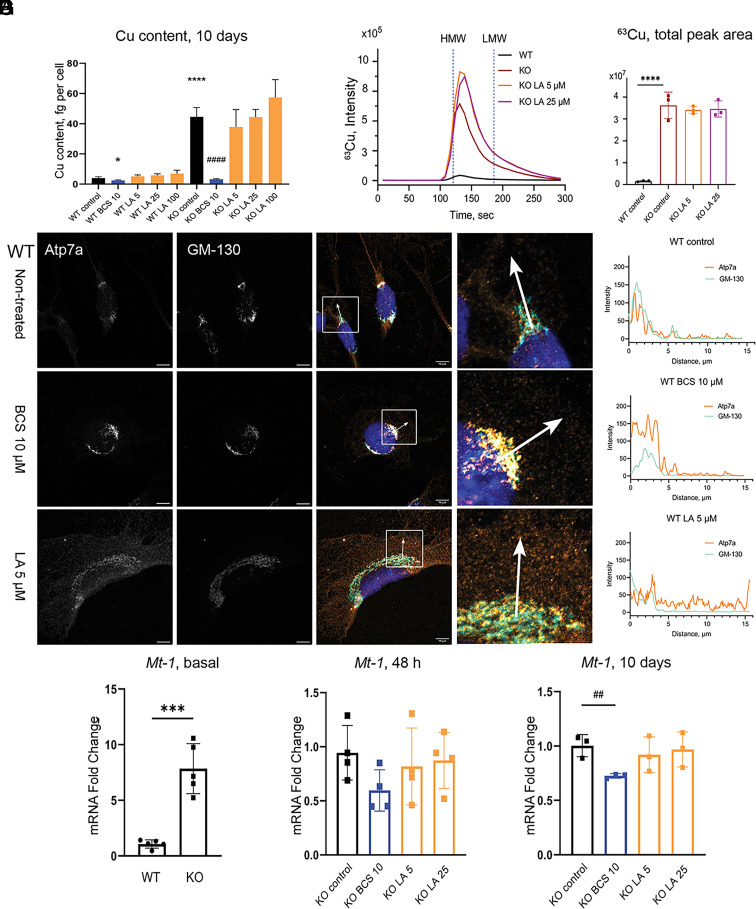
Fig. 2.
LA does not alter cellular Cu content and causes relocalization of Atp7a in 3T3-L1 cells. (A) Cu content in WT and KO preadipocytes after 10 d of treatment with 10 µM BCS or different concentrations of LA. (B) Localization of Atp7a in 3T3-L1 WT cells after 10 d of treatment with 10 µM BCS or 5 µM LA. Orange Atp7a, cyan GM-130 (scale bar, 10 µm). Differences in the localization pattern of Atp7a and GM-130 are shown in white squares. Colocalization of Atp7a and GM-130 is quantified using ImageJ and visualized in GraphPad Prism. (C) Average chromatogram (n = 3 per group) of 63Cu species in cell lysates of 3T3-L1 KO preadipocytes after 10 d of treatment with different concentrations of LA and (D) quantification of total 63Cu peak areas normalized by 133Cs signal and protein content (mean ± SD, n = 3). Nontreated WT and KO cells were used as respective controls. Vertical blue dashed lines (120.8 s and 186 s) indicate the retention time of high- and low-molecular-weight species (HMW and LMW, correspondingly) based on retention time of CuHSA (M ≈ 66 kDa) and Cu-EDTA (Mw 355.8 Da), respectively (SI Appendix, Fig. S5). (E) Relative expression of Mt-1 in WT and KO preadipocytes on day 0 (n = 5), (F) after 48 h (n =4), and (G) after 10 d (n=3) of treatment with BCS or LA. For panels (A, D, E, and G): P-values for WT cells shown with asterisks (*) and for KO cells with sharp (#); * – P-value < 0.05; ## – P-value < 0.01; ***, ### – P-value < 0.001; **** – P-value < 0.0001.

