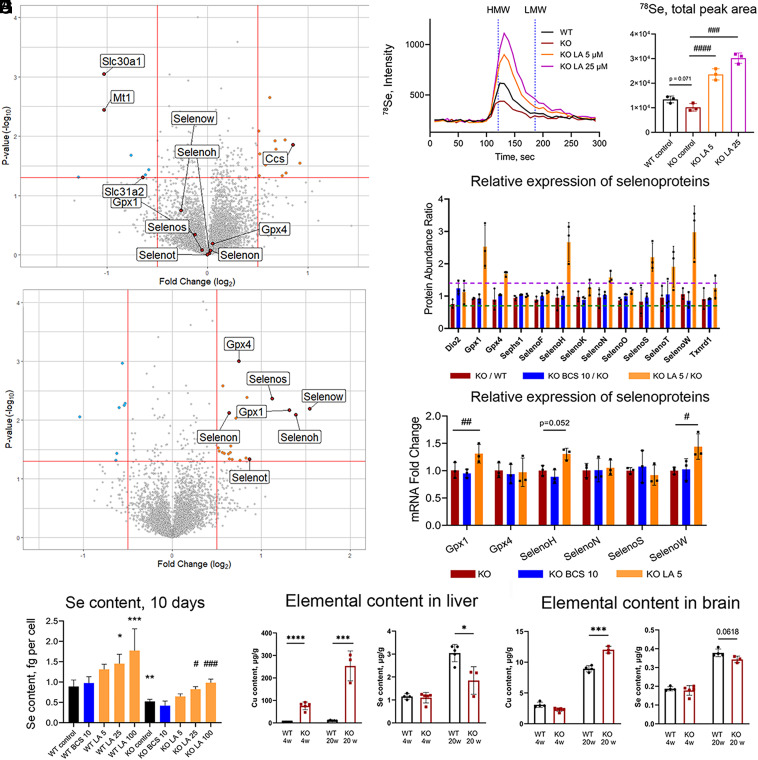
Fig. 3.
LA up-regulates selenoproteins and increases cellular Se content. (A) Volcano plot comparing proteome of KO cells treated with 10 µM BCS for 10 d to nontreated KO cells and (B) KO cells treated with 5 µM LA for 10 d to nontreated KO cells. (C) Average chromatogram (n = 3 per group) of 78Se species in cell lysates of KO preadipocytes after 10 d of treatment with different concentrations of LA and (D) quantification of total 78Se peak areas normalized by 133Cs signal and by protein content (data present as mean ± SD, n = 3). Nontreated WT and KO cells are used as controls. Vertical dashed lines (120.8 s and 186 s) demonstrate retention time of high- and low-molecular-weight species (HMW and LMW, correspondingly) based on retention time of CuHSA (Mw ≈ 66 kDa) and Cu-EDTA (Mw 355.8 Da), correspondingly (SI Appendix, Fig. S5). (E) Relative abundances of all selenoproteins identified by TMT labeling mass spectrometry in WT and KO preadipocytes after 10 d of treatment with 10 µM BCS or 5 µM LA (n = 3). The horizontal dashed lines at 1.4 (purple) and 0.7 (dark-green) indicate cutoff values for significant changes in protein abundance (upregulation and downregulation, correspondingly). (F) The mRNA for selenoproteins in KO cells relative to WT without treatment and after 10 d of treatment with 10 µM BCS or 5 µM LA (n = 3). For more details, see SI Appendix, Figs. S9 and S10. (G) Selenium content in WT and KO preadipocytes after 10 d of treatment with 10 µM BCS or different concentrations of LA. (H) Cu and Se content in the liver and brain tissue of 4- and 20-wk-old WT and Atp7b−/− mice; the two-tailed t-test was used for pairwise statistical analysis. For panels (D–G): comparison to nontreated WT cells is indicated with asterisks (*) and comparison with nontreated KO cells with sharp (#). For panels (F–I): *, # – P-value < 0.05; **, ## – P-value < 0.01; ***, ### – P-value < 0.001; ****, #### – P-value < 0.0001.

