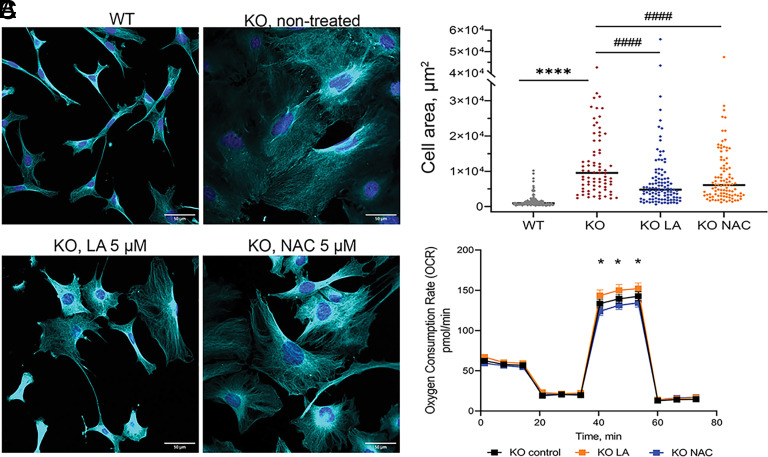
Fig. 5.
NAC partially improves morphology but not mitochondrial respiration of Atp7a−/− preadipocytes. (A) Morphological changes in KO preadipocytes after 10 d of treatment with 5 µM LA or 5 µM NAC compared to nontreated KO and WT cell lines visualized with immunostaining. Cyan α-tubulin (scale bar, 50 µm). (B) Changes in cell area after 10 d of treatment with 5 µM LA or 5 µM NAC. Each dot corresponds to an individual cell. The black line represents the median cell area. Comparison to nontreated WT cells is designated with asterisks (*) and comparison with the nontreated KO cell line is designated with sharp (#). ****, #### – P-value < 0.0001. Cell areas were determined using ImageJ software. (C) Oxygen consumption rate (OCR) of KO cells treated with 5 µM LA (shown in orange) or 5 µM NAC (shown in blue) for 48 h compared to nontreated KO cells (shown in black). * – comparison of NAC-treated cells to LA-treated cells, * - P-value < 0.05.

