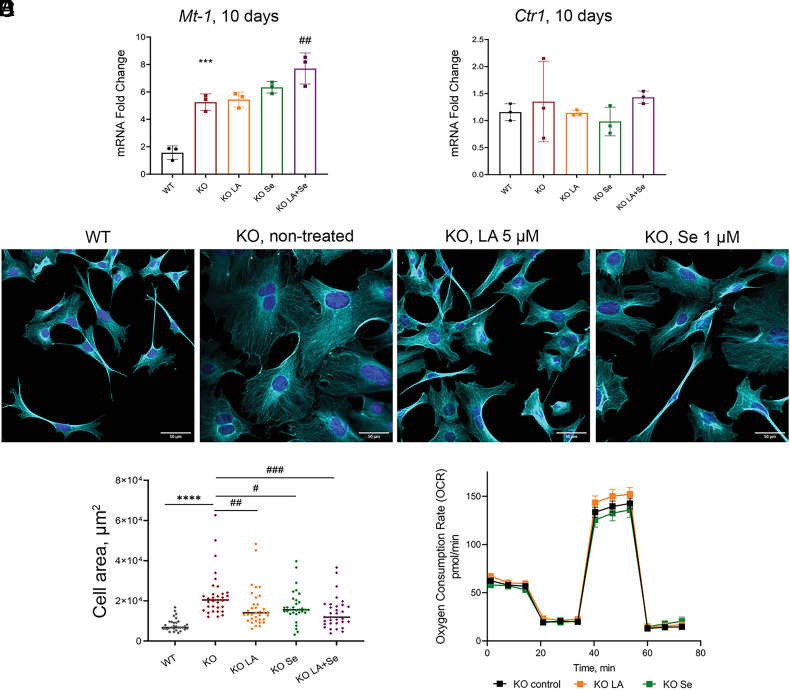
Fig. 6.
Se improves morphology but not mitochondrial respiration of Atp7a−/− preadipocytes. (A) Relative expression of Mt-1 and (B) Ctr1 genes after 10 d of treatment with 5 µM LA or 1 µM Se, alone or in combination. (C) Morphological changes in KO preadipocytes after 10 d of treatment with 5 µM LA or 1 µM Se compared to nontreated KO and WT cell lines confirmed with immunostaining. Cyan α-tubulin (scale bar, 50 µm). (D) Changes in cell area after 10 d of treatment with 5 µM LA or 1 µM Se, alone or in combination. Each dot corresponds to an individual cell within the field of view. The black line represents the median cell area. Cell areas were determined using ImageJ software. (E) Oxygen consumption rate (OCR) of KO cells treated with 5 µM LA (shown in orange) or 1 µM Se (shown in dark-green) for 48 h compared to nontreated KO cells (shown in black). For panels (A and D): comparison to nontreated WT cells designated with asterisks (*); comparison with the nontreated KO cell line designated with sharp (#); # - P-value < 0.05; ## – P-value < 0.01; ***, ### – P-value < 0.001; **** – P-value < 0.0001.

