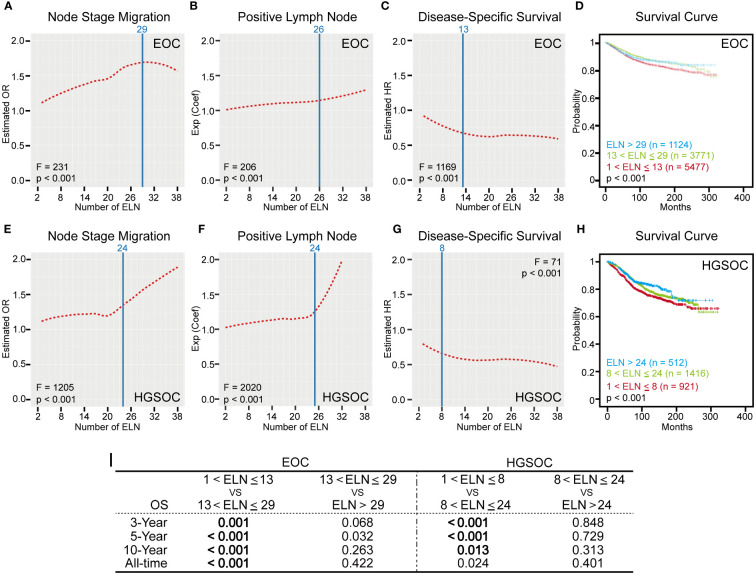
Figure 3.
Numbers of ELN for overall early-stage EOC and HGSOC. (A, E) LOESS fitting curves based on ORs in ascending order of the number of ELN for early-stage EOC and HGSOC. (B, F) LOESS fitting curves based on exp (Coef) in ascending order of the number of ELN for early-stage EOC and HGSOC. (C, G) LOESS fitting curves based on HRs in ascending order of the number of ELN for early-stage EOC and HGSOC. ELN structural breakpoints for node stage migration, PLN and DSS based on Chow test are shown as blue lines in (A–C) and (E–G). (D, H) Kaplan-Meier plots for DSS based on ELN structural breakpoints of early-stage EOC and HGSOC. (I) Log-rank test P values for DSS of different ELN subgroups. P values less than 0.016 are statistically significant.

