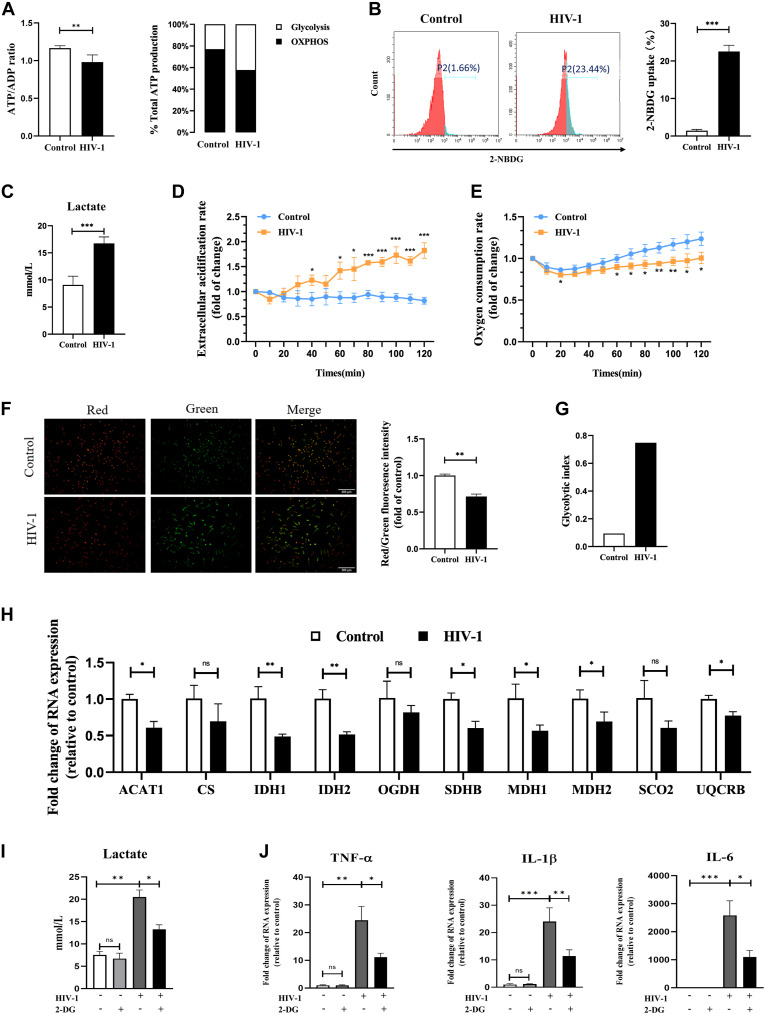
Figure 2. Metabolism reprogramming affects polarization in HIV-1–infected macrophages.
(A) ATP/ADP ratio (left panel) and relative ATP production from glycolysis and oxidative phosphorylation (right panel) in monocyte-derived macrophages (MDMs) infected or uninfected with HIV-1. (Statistical analysis was performed using a t test, *P < 0.05, **P < 0.01, and ***P < 0.001.) (B) Representative results of glucose uptake analyzed by flow cytometry. (Statistical analysis was performed using a t test, ***P < 0.001.) (C) Lactate concentration in the supernatant of MDMs infected with HIV-1 for 48 h was detected using colorimetry. (Statistical analysis was performed using a t test, ***P < 0.001.) (D, E) Extracellular acidification rate and oxygen consumption rate of MDMs infected with HIV-1 for 48 h. Time-resolved fluorescence was applied and monitored for 120 min. Results were relative to 0 min. (Statistical analysis was performed using a t test, *P < 0.05, **P < 0.01, and ***P < 0.001.) (F) Mitochondrial membrane potential was assessed using the JC-1 assay. A change from red to green fluorescence indicates a decrease in the mitochondrial membrane potential. The red/green fluorescence ratio was calculated for comparison. (Statistical analysis was performed using a t test, **P < 0.01.) Scale bar, 300 μm. (G) Bar plot showed glycolytic index (GI) differences in control and HIV-1–infected MDMs. (H) mRNA expressions of key genes in TCA and oxidative phosphorylation. (Statistical analysis was performed using a t test, ns non-significant, *P < 0.05, **P < 0.01, and ***P < 0.001.) (I, J) MDMs were pretreated with or without 2-DG (10 mM) for 2 h, followed by infection of HIV-1 for 48 h. (I, J) Lactate concentration in the culture supernatant (I), and mRNA expressions of TNF-α, IL-1β, and IL-6 (J) were detected. (Statistical analysis was performed using a t test, *P < 0.05, **P < 0.01, and ***P < 0.001).

