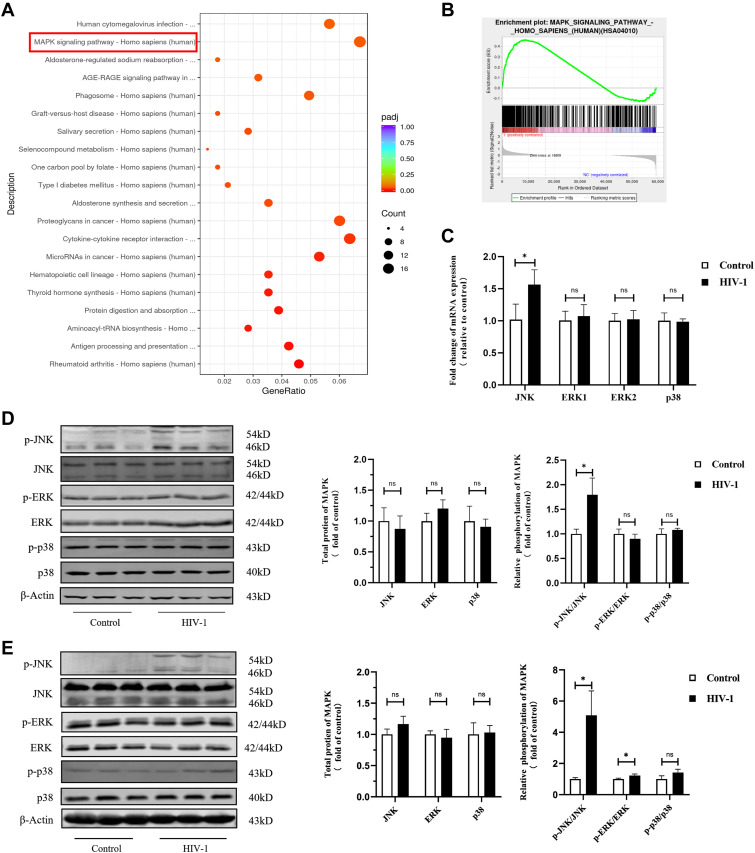
Figure 7. HIV-1 urges phosphorylation of JNK in macrophages.
THP-1 macrophages and primary monocyte-derived macrophages (MDMs) were infected with or without HIV-1 for 48 h. (A) KEGG enrichment analysis of differentially expressed genes in HIV-1–infected THP-1 macrophages and control macrophages. The size of the bubble positively correlated with the number of enriched genes. The x-axis represents the gene ratio, and the color of the bubble represents the adjusted P-value of enrichment analysis. (B) Gene set enrichment analysis was performed in Control and HIV-1 groups. In this figure, the y-axis represents enrichment score (ES), and on the x-axis are genes (vertical black lines) included in gene sets. The analysis demonstrates that the MAPK signaling pathway is enriched in the HIV-1 group (NES = 1.315, P-value < 0.0001, FDR = 0.301). The detailed information is provided in Table S1. (C) RT–qPCR analysis showed the mRNA levels of JNK, ERK, and p38 in MDMs. (Statistical analysis was performed using a t test, *P < 0.05.) (D, E) Western blot confirmed phosphorylation of JNK is increased in MDMs (D) and THP-1 macrophages (E) upon HIV-1 infection. (Statistical analysis was performed using a t test, *P < 0.05).

