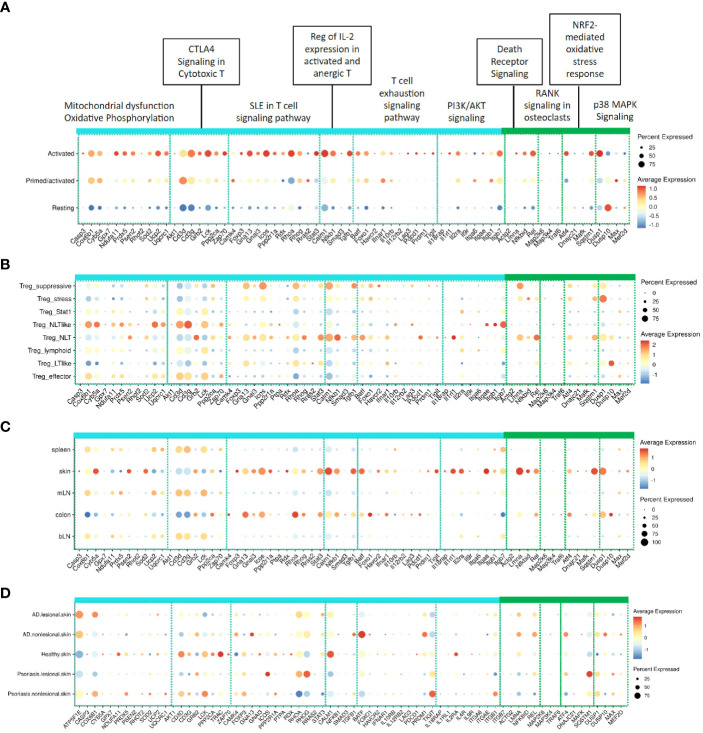
Figure 6.
Expression of representative signature genes in the turquoise and green modules in related published mouse and human scRNA-Seq datasets. (A) Expression across activation states in mouse Tregs stimulated with muIL-2 as defined in Lu et al. (26); Expression across (B) Treg subpopulations and (C) Tregs found in different tissues as defined by Miragaia et al. (27); (D) Distribution across healthy tissue from healthy donor, non-lesional and lesional skin tissues from atopic dermatitis and psoriasis patients in Reynolds et al. (40), The color of dots indicates the scaled average expression in all cells in the corresponding group and the size of dots represents the percentage of the cells with at least one transcript detected.

