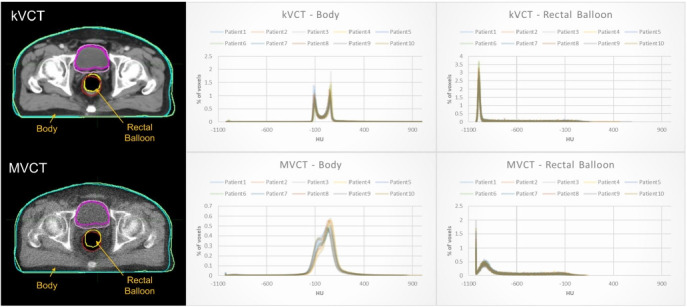
Fig. 3.

Comparison of the image intensity histograms, plotted using Hounsfield unit (HU) value on the x-axis and the percentage of voxel counts on the y-axis, between body outline (blue line for kVCT and light blue line for MVCT) and rectal balloon (yellow line for kVCT and brown line for MVCT) volumes in kVCT and MVCT images for ten patients. kVCT, kilovoltage computed tomography; MVCT, megavoltage computed tomography.
