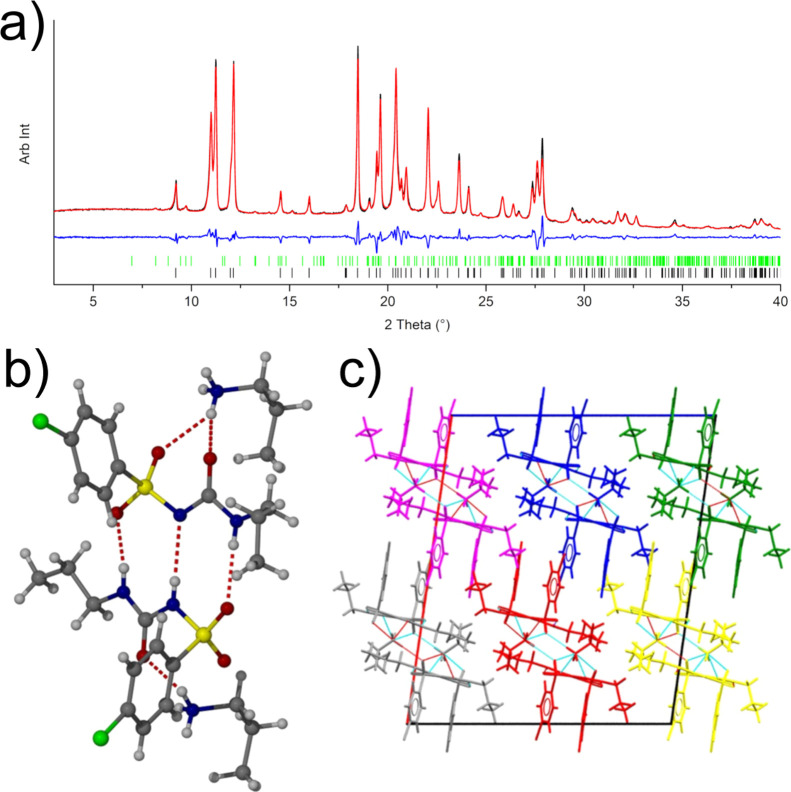
Figure 7.
(a) Rietveld refinement of the data obtained from a partially aged acetone solution of CPA. Shown in the plot are the collected XRPD pattern (black), fitted pattern (red), and difference plot (blue). The pattern is dominated by β-CPA (black tick marks), with a minor contribution from the propylamine salt of CPA (green tick marks). (b) Main hydrogen bonding observed in the structure of the impurity n-propylammonium salt of CPA and (c) crystal packing in the structure as viewed along the [010] direction. The structure can be considered as a series of infinite chains running along the [010] direction; the discrete chains are highlighted in different colors.

