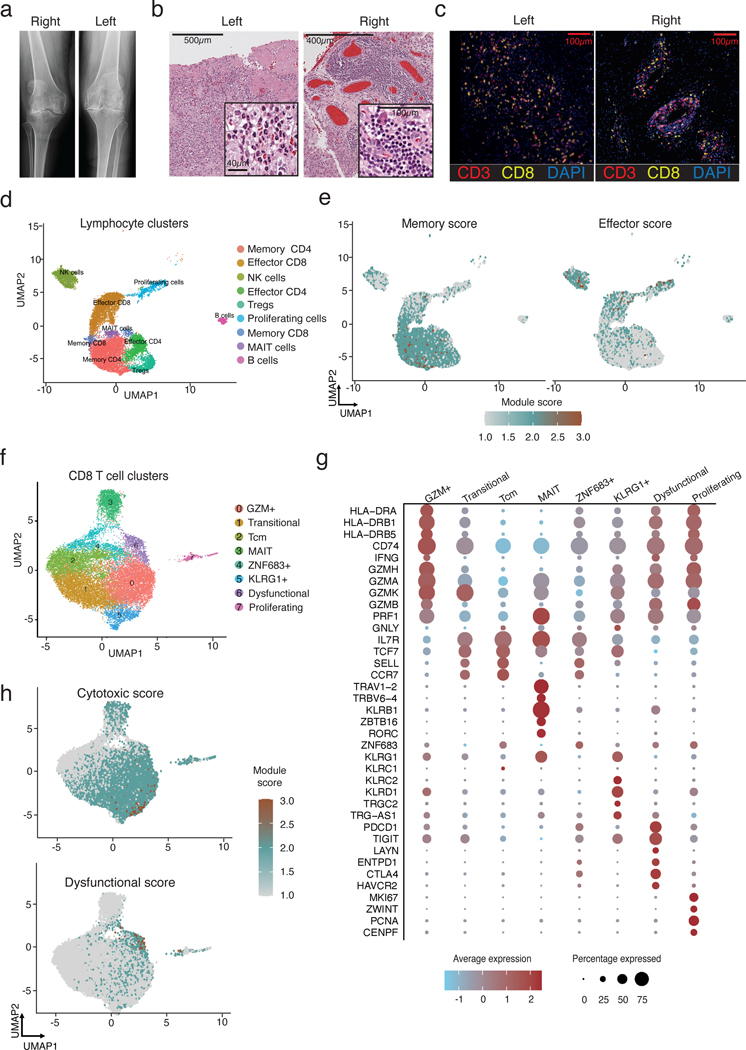
Figure 1. Activated CD8 T cells accumulate in the synovium in ICI-arthritis.
a) Left and right knee radiographs prior to arthroplasty. b) Left and right knee synovial tissue H&E histology. c) Multiplexed immunofluorescence images showing diffuse CD8 T cell infiltration in left knee and aggregate-like CD8 T cell infiltration in right knee. CD3 staining is shown in red, CD8 in yellow, nuclear stain DAPI in blue. d) Synovial tissue (bilateral knee explants from n=1) and synovial fluid (n=5) lymphocytes resolve into 9 distinct clusters using scRNA-seq. e) UMAP visualization of T cell effector and memory signature scores for all lymphocytes in synovial samples. f) Synovial fluid (n=4) and tissue (bilateral knee explants from n=1) CD8 T cells analyzed by scRNA-seq and plotted in clusters in UMAP space. g) Dotplot visualization of differentially expressed genes that distinguish CD8 T cell clusters. Color of the dot represents the average expression of the gene across cells in the cluster. Size of the dot represents the percentage of cells h) UMAP visualization of T cell cytotoxic and dysfunctional signature scores for all CD8 T cells in synovial samples.

