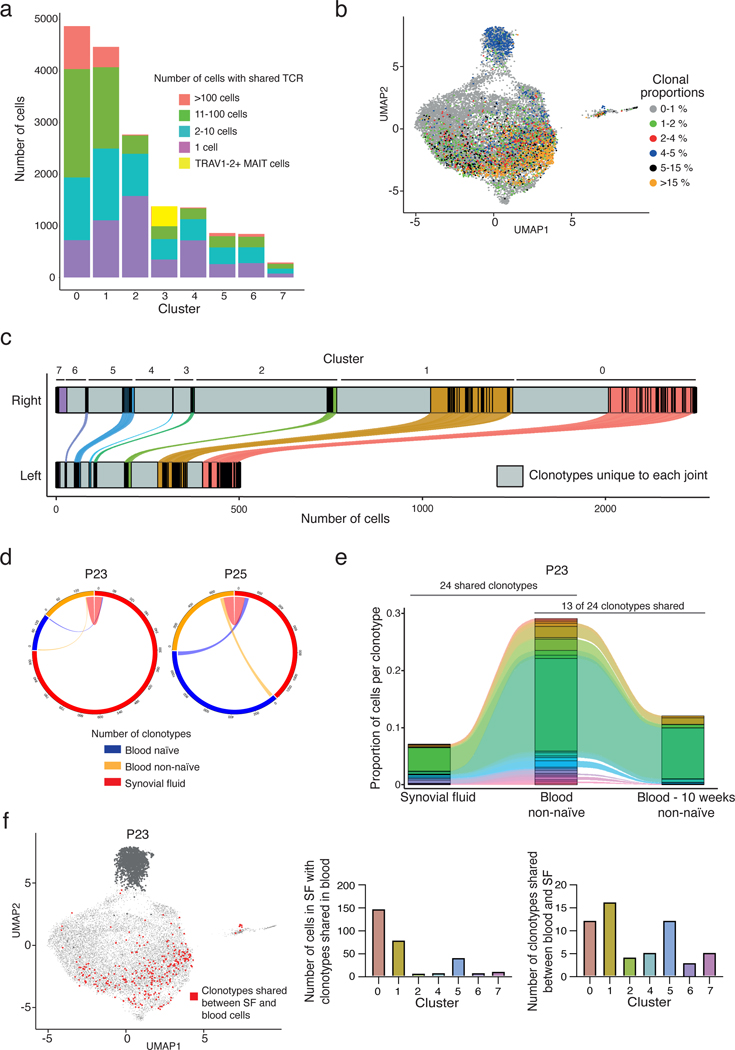
Figure 2. Extensive clonal expansion and proliferation of synovial CD8 T cells in ICI-arthritis.
a) The number of cells in each synovial CD8 T cell cluster that either contains a unique TCR (purple) or a shared TCR (all other colors, for which the total number of clones from the sample is represented by the specific color). Yellow in Cluster 3 represents TRAV1–2+ invariant MAIT cells. b) Expanded TCR clones (>1% of T cells from a patient) depicted onto the transcriptionally defined UMAP clustering. c) Number of distinct (gray) and shared CD8 TCR clonotypes in left and right knee from each transcriptionally defined cluster. Colored bars represent clonotypes in each cluster that can be found in both joints. Distance between black lines in the colored segment represents the size (number of cells) of shared clonotypes. d) Circle plot showing the number of clonotypes expressed in and shared between paired synovial fluid and blood CD8 T cells (n=2 patients). e) Representative alluvial plot of the proportion of shared clonotypes between paired synovial fluid and non-naïve blood CD8 T cells further compared to non-naïve blood CD8 T cells collected 10 weeks later for P23. f) UMAP representation of clonotypes shared between paired synovial fluid CD8 T cells and blood naïve and non-naïve CD8 T cells in P23. MAIT cells were excluded in the analysis (dark gray dots). Bar graphs show the number of cells contained in the shared clonotypes and the number of shared clonotypes in each cluster. Cluster IDs for figures (a), (c) and (f): 0 - GZM+, 1 - Transitional, 2 - Tcm, 3 - MAIT, 4 - ZNF683+, 5 - KLRG1+, 6 - Dysfunctional, and 7 - Proliferating.

